
Average Shopify Conversion Rate (2026): Benchmarks by Industry, Device and Funnel Step

Summarize this article with AI


The median Shopify store converts 1.4%, the top 20% hit 2.8%. Benchmarks by industry, device and funnel step, why sources disagree, and what to fix first.
Ask ten Shopify merchants what a "normal" conversion rate is and you will hear anything from 1% to 5%. Both numbers are real. They come from different stores, different traffic and different ways of counting.
This guide puts the freshest public benchmarks side by side: Littledata(opens in a new tab)'s panel of 449 Shopify stores (90 days to November 14, 2026), IRP Commerce(opens in a new tab)'s UK market data for October 2026, DTC Pages(opens in a new tab)' Q3 2026 Shopify cohort, Growth Suite(opens in a new tab)'s 958-store study and Baymard Institute(opens in a new tab)'s checkout research. You get the median, the percentiles, the split by industry, device, store size and funnel step, and a way to read your own number against them.
Trafik Plus is a Shopify agency. We develop Shopify themes, including our own theme Pops, and we run conversion work on client stores. Where we mention Pops below, we say so.
The short answer
- Median Shopify store: 1.4% of sessions end in an order. The mean is higher (1.9%) because a few stores convert very well (Littledata(opens in a new tab), 449 stores, Aug 17 to Nov 14, 2026).
- Good: 2.8% or more puts you in the top 20% of Shopify stores. Excellent: 3.8% or more puts you in the top 10%.
- Below 0.5% puts you in the bottom 20%. That usually points to a traffic, tracking or offer problem, not a button colour.
- Industry matters more than any other factor. Median beauty stores convert at 2.7%, median fashion and home stores at 1.0%, jewelry at 0.8%.
- Benchmarks that quote 2.5% to 3% are not wrong. They come from smaller or pre-filtered panels, a different formula, or a single strong month.
How Shopify calculates conversion rate
In Shopify Analytics, conversion rate is sessions that placed an order ÷ total sessions over a period. A session ends after 30 minutes without activity, so one shopper who visits three times in a week counts as three sessions. Shopify shows the full funnel in the same report: sessions with an add to cart, sessions that reached checkout, and sessions that converted (Shopify(opens in a new tab)).
That definition explains most of the gaps between sources:
- Session-based vs visitor-based. A visitor-based rate (orders ÷ unique visitors) is always higher, because returning buyers are counted once.
- Shopify Analytics vs GA4. GA4 loses sessions to consent banners and ad blockers, so a GA4 rate is often higher than the Shopify one for the same store.
- Orders vs transactions. Some panels, such as IRP Commerce, divide transactions by sessions across all retail sites, not only Shopify.
- Bots and internal traffic. A spike of bot sessions lowers the rate without any real change in shoppers.
Before you compare yourself to anyone, check which formula you are reading.
Shopify conversion rate benchmarks by percentile
Littledata's panel is the most useful starting point because it reports the whole distribution, not just an average. Stores need at least 1,000 sessions and 90 purchases in the window to be included.
Metric | Bottom 10% | Bottom 20% | Median | Top 20% | Top 10% |
|---|---|---|---|---|---|
Conversion rate (all devices) | 0.3% | 0.5% | 1.4% | 2.8% | 3.8% |
Conversion rate (mobile) | 0.3% | 0.6% | 1.6% | 3.1% | 4.3% |
Conversion rate (desktop) | 0.3% | 0.5% | 1.3% | 3.2% | 4.9% |
Add-to-cart rate | 2.5% | 3.7% | 7.1% | 13% | 18% |
Checkout completion | 14% | 24% | 46% | 64% | 73% |
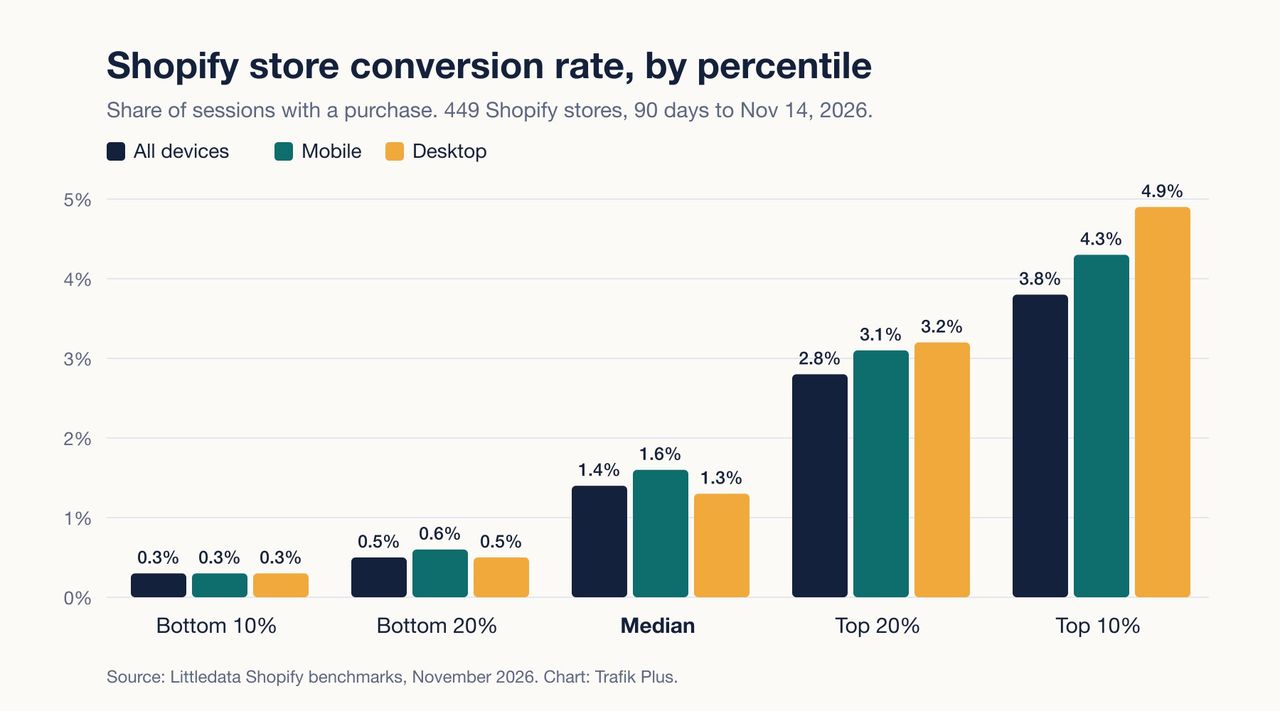
Three things stand out:
- The gap is wide. A top-10% store converts more than 12 times better than a bottom-10% store. "Average" hides most of what matters.
- Mobile beats desktop at the median (1.6% vs 1.3%), but desktop wins at the top (4.9% vs 4.3%). Strong stores make desktop work for high-intent, high-basket buyers.
- Most of the gap is in the funnel, not the traffic. The median store gets 7.1% of sessions to add to cart; the top 10% get 18%. Checkout completion climbs from 46% to 73%.
Why every benchmark gives a different number
Search "average ecommerce conversion rate" and you will find figures from 1.4% to 3%+. Here is where each one comes from.
Source | Period | Panel | Headline rate | What it measures |
|---|---|---|---|---|
Aug 17 to Nov 14, 2026 | 449 Shopify stores (min. 1,000 sessions, 90 orders) | 1.4% median, 1.9% mean | Sessions with a purchase, via GA4 | |
Q1 2026 | Global online retail | 1.4% | Share of visits that converted | |
October 2026 | UK retail sites, all platforms | 1.83% | Transactions ÷ sessions | |
Jan to Jun 2026 | 958 Shopify stores | 2.2% average | Store-level average, by industry | |
Q3 2026 | 18 Shopify DTC brands, 189.6M sessions | 2.33% median, 2.56% mean | Sessions converted, Shopify Analytics | |
2026 | 400+ brands on its platform | 2.66% | Brands already paying for personalisation |
The pattern is simple. Broad panels land between 1.4% and 1.9%. Panels of brands that already invest in CRO, personalisation or paid tools land between 2.2% and 2.7%. Neither is "the" answer. Use the broad panels to know where you stand, and the selective ones to see what is possible.
Note the trend too. IRP's UK rate rose from 1.63% in October 2025 to 1.83% in October 2026, while DTC Pages' cohort slipped from 2.83% in Q3 2025 to 2.56% in Q3 2026. Traffic mix moves these numbers as much as store quality does.
Shopify conversion rate by industry
What you sell sets the ceiling. Consumables and repeat purchases convert well; considered, high-price and fit-sensitive products convert less.
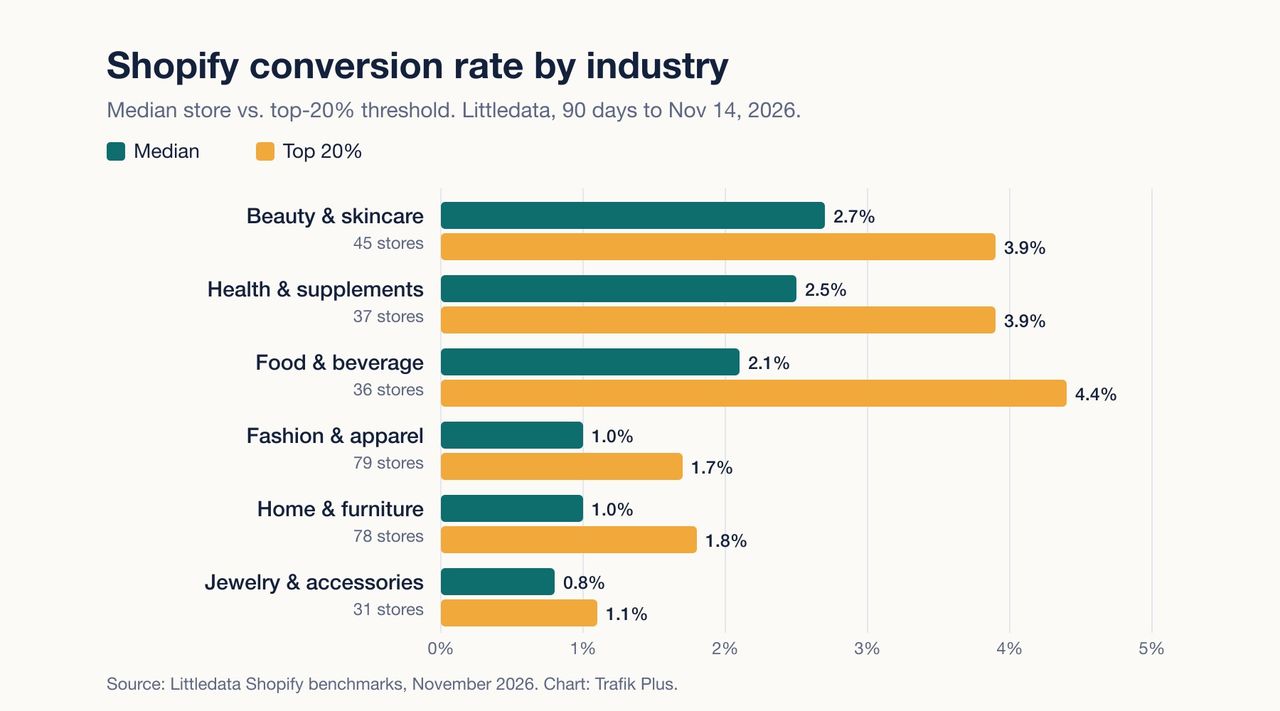
Three sources, three panels, the same ranking:
Industry | Littledata median (Nov 2026) | Littledata top 20% | Growth Suite range (H1 2026) | IRP Commerce UK (Oct 2026) |
|---|---|---|---|---|
Beauty & skincare | 2.7% | 3.9% | 4.5–4.9% | Not reported |
Health & supplements | 2.5% | 3.9% | 3.0–3.5% | 2.43% |
Food & beverage | 2.1% | 4.4% | 2.0–3.0% | 1.32% |
Pet | Not reported | Not reported | 2.5–3.0% | 2.07% |
Fashion & apparel | 1.0% | 1.7% | 2.5–3.1% | 1.45% |
Home & furniture | 1.0% | 1.8% | 2.0–2.5% | 2.05% (kitchen & home) |
Jewelry & accessories | 0.8% | 1.1% | 1.5–2.5% | Not reported |
Sports | Not reported | Not reported | 2.0–2.5% | 1.83% |
Electronics | Not reported | Not reported | 1.4–2.3% | Not reported |
Luxury | Not reported | Not reported | 1.0–1.5% | Not reported |
Dynamic Yield's June 2026 data(opens in a new tab) tells the same story at a higher level: pet 5.7%, beauty 5.32%, food and beverage 4.58%, fashion 2.77%, consumer goods 1.76%, home 1.29%, luxury 0.63%.
How to use this: compare yourself to your own industry's median first. A fashion store at 1.5% is beating the median fashion store. A supplements store at 1.5% is below its peers, even though both stores show the same number.
Shopify conversion rate by device
Mobile brings most of the traffic and, on most stores, a lower rate per session.
- Littledata (Shopify, Nov 2026): mobile 1.6% vs desktop 1.3% at the median. Mobile is 41% of sessions in the panel (Littledata(opens in a new tab)).
- DTC Pages (Q3 2026): mobile 2.49% on 86.3% of traffic, desktop 4.08% (DTC Pages(opens in a new tab)).
- Contentsquare (2026): mobile is 69.9% of retail visits; retail converts at 3.7% on desktop vs 2% on mobile (via Shopify(opens in a new tab)).
- IRP Commerce (UK, Oct 2026): mobile takes 63.4% of sales (IRP Commerce(opens in a new tab)).
The takeaway is not "mobile converts badly." It is that mobile traffic is bigger, colder and more often from social. Brands that drive a lot of paid social see a wide device gap. Brands with strong search and email traffic see a narrow one. Always read your conversion rate by device and by channel before you change anything.
Conversion rate by store size and order value
Two more cuts help you pick the right comparison.
By traffic. Smaller stores tend to post higher rates, because their traffic is mostly warm (friends, email, brand search). As stores buy reach, the rate drops (Growth Suite(opens in a new tab)):
Monthly sessions | Typical conversion rate |
|---|---|
Under 5,000 | 2.0–3.5% |
5,000 to 50,000 | 1.5–2.5% |
Over 50,000 | 1.0–2.0% |
By average order value. In DTC Pages' Q3 2026 cohort, stores with an AOV under $60 had a median rate of 2.64%, $60 to $100 had 2.58%, and $100+ had 1.27% (DTC Pages(opens in a new tab)). A higher price means a longer decision. That is why revenue per session is a better north-star than conversion rate alone: IRP's UK average was £1.67 per session on a £122.94 AOV in October 2026 (IRP Commerce(opens in a new tab)). If you are raising order value with bundles or a free shipping threshold, expect the rate to dip a little while revenue per session goes up.
Funnel benchmarks: add to cart, checkout and abandonment
Conversion rate is the product of three steps. Benchmark each one so you know where your store leaks.
Funnel step | Median Shopify store | Top 20% | Source |
|---|---|---|---|
Add-to-cart rate (sessions with an add to cart) | 7.1% | 13% | |
Reached checkout (share of sessions) | 5.16% | Not reported | |
Checkout completion | 46% | 64% | |
Cart abandonment | 79% | 65% (best 20%) | |
Cart abandonment, all ecommerce (50 studies) | 70.22% average | Not reported |
A quick way to read your own funnel:
- Add-to-cart rate under 4%: shoppers do not want the product at this price, or they cannot judge it. Work on the product page, the offer and the traffic.
- Add to cart fine, few reach checkout: the cart is the problem. Surprise shipping costs, a clunky drawer or a missing express-pay button. See our cart drawer vs cart page breakdown.
- Reach checkout, do not finish: the checkout or the payment options are the problem.
Why shoppers abandon: Baymard's numbers
Baymard asked US shoppers who abandoned an order in the last three months why they left. Excluding those "just browsing", the top reasons are (Baymard(opens in a new tab)):
Reason for abandoning | Share of shoppers | What to check on Shopify |
|---|---|---|
Extra costs too high (shipping, tax, fees) | 40% | Show shipping early, add a free shipping bar |
Delivery too slow | 20% | Show delivery dates on the product page |
Did not trust the site with card details | 19% | Payment icons, reviews, a clean checkout |
Had to create an account | 18% | Keep guest checkout on |
Checkout too long or complicated | 17% | Turn on Shop Pay and other express buttons |
Website errors or crashes | 17% | Test apps and theme on real phones |
Return policy not good enough | 13% | Link returns from the product page and cart |
Could not see total cost upfront | 12% | Shipping estimate in the cart |
Card was declined | 10% | Offer more payment methods |
Not enough payment methods | 9% | Add PayPal, Apple Pay, Google Pay, local methods |
Baymard also estimates that the average large ecommerce site can lift conversion by 35.26% through checkout design alone, and that the average checkout shows 23.48 form elements when 12 to 14 would do (Baymard(opens in a new tab)). Shopify's checkout already removes much of this, which is one reason Shopify stores sit where they do. The remaining leaks are mostly before checkout: costs, trust and speed. Our guide to reducing cart abandonment goes deeper.
How to benchmark your own Shopify store
- Use 30 days minimum, 90 if you can. A weekly rate swings with every campaign.
- Pull the funnel, not just the headline. In Shopify Analytics, open the conversion rate breakdown: sessions, added to cart, reached checkout, converted.
- Split by device and by channel. Paid social, email and organic search have very different rates. A blended number hides which one moved.
- Compare to your industry median, then the top 20%. Use the tables above.
- Track revenue per session next to conversion rate. A drop in rate with a rise in revenue per session is often a win.
- Check your tracking before you panic. A theme change, a consent banner or a new app can break or duplicate events.
What to fix, step by step
Start with the step where you are furthest from your industry's top 20%.
Traffic and landing pages
- Send ad clicks to a matching collection or product page, not the home page.
- Cut traffic that never converts. If a campaign brings sessions at 0.2%, it is dragging your average.
Product page (add-to-cart rate)
- Clear price, delivery date and return policy above the fold.
- Real photos, video and size or ingredient detail. Reviews near the price.
- A sticky add-to-cart bar on mobile, so the button stays in reach while shoppers scroll.
- Fast load. Every extra second on mobile costs sessions before they see the product. See our Shopify speed optimization guide.
Cart (reached checkout)
- Show shipping cost or a free shipping progress bar in the cart. Extra costs are the first reason shoppers leave. Set the right free shipping threshold.
- Express payment buttons in the cart drawer, not only in checkout.
- One relevant upsell, not five.
Checkout (checkout completion)
- Turn on Shop Pay, Apple Pay, Google Pay and PayPal.
- Keep guest checkout. Remove optional fields you do not use.
- Recover the rest with an abandoned cart email flow.
If you want a team to run this end to end with tests, see our Shopify CRO agency page.
What your theme changes, and what it does not
A theme does not fix a weak offer or bad traffic. It does decide how fast pages load, how easy the add-to-cart button is to reach, and whether shoppers see costs early. Those are the three leaks above.
Here is what to look for, and how Pops, the theme we develop, handles each one:
Conversion feature | Why it matters | Pops |
|---|---|---|
Sticky add-to-cart bar | Keeps the button in reach on mobile product pages | ✅ Yes |
Quick add from product cards | Fewer page loads between collection and cart | ✅ Yes |
Cart drawer with free shipping bar | Shows costs early, the first reason for abandonment | ✅ Yes |
Cart upsell slider | Lifts order value without a pop-up | ✅ Yes |
Express checkout buttons on product page | Skips the cart for ready buyers | ✅ Yes |
Predictive search | Shoppers who search convert more often | ✅ Yes |
Review rating block (Trustpilot) | Trust near the price | ✅ Yes |
Payment icons | Shows accepted methods before checkout | ✅ Yes |
Countdown timer | Real deadlines for real promotions | ✅ Yes |
For a wider comparison, see our list of the highest-converting Shopify themes.
FAQ
What is the average conversion rate on Shopify?
The median Shopify store converts 1.4% of sessions into orders and the mean is 1.9%, based on Littledata's panel of 449 Shopify stores over the 90 days to November 14, 2026. Smaller, curated panels report 2.2% to 2.6% (Littledata(opens in a new tab), DTC Pages(opens in a new tab)).
What is a good conversion rate for a Shopify store?
2.8% or more puts a Shopify store in the top 20%, and 3.8% or more in the top 10%. Compare yourself to your industry first: 1.7% is top 20% in fashion, while beauty and health stores need about 3.9%.
Is a 1% conversion rate good on Shopify?
1% is below the overall median (1.4%) but equal to the median for fashion and home stores. For jewelry, 1% is above the median. For beauty, health or food stores, it is well below peers.
Is 3% a good conversion rate?
Yes. 3% beats about 80% of Shopify stores overall. In food and beverage, beauty or supplements, the top 20% sit between 3.9% and 4.4%, so there may still be room to grow.
Why is my Shopify conversion rate so low?
The usual causes are cold or mismatched traffic (often paid social), surprise shipping costs, a slow mobile product page, missing express payment buttons and broken tracking. Look at your funnel by device and channel to find which step leaks.
How does Shopify calculate conversion rate?
Shopify divides sessions that placed an order by total sessions in the period. A session ends after 30 minutes without activity. GA4 and visitor-based reports use different rules, so their rate will not match Shopify's.
What is a good add-to-cart rate on Shopify?
The median Shopify store gets 7.1% of sessions to add to cart. 13% is top 20% and 18% is top 10% (Littledata(opens in a new tab)).
What is the average cart abandonment rate?
Baymard's average across 50 studies is 70.22%. For Shopify stores in Littledata's panel, the median is 79%, and the best 20% of stores stay at 65% or below (Baymard(opens in a new tab), Littledata(opens in a new tab)).

Keep reading

Shopify Rollouts: How to Schedule Launches, Run Events and A/B Test Your Store
Shopify Rollouts lets you schedule theme, checkout, catalog and discount changes, run time-boxed events and A/B test them natively. How it works, limits and how to read results.

What Is Shop Pay and Is It Safe? A Guide for Shoppers and Merchants
Shop Pay is Shopify's one-tap checkout. Here is how it works, how safe it is, how to spot Shop Pay scams, and what merchants should know before turning it on or off.

SEO vs PPC: Organic vs Paid Search on a Fixed Budget
SEO vs PPC for a Shopify store with a fixed budget: cost per click vs cost per page, click share data, when to move spend, and a worked $3,000 budget split.