
How to Increase ROAS From Your Store, Not Your Ad Account

Summarize this article with AI


ROAS = conversion rate × AOV ÷ CPC. Here is how to raise the store side of that formula, landing pages, bundles, checkout, email and LTV, with worked numbers.
ROAS (return on ad spend) is revenue divided by ad spend. To increase ROAS, you either pay less for each click or earn more from each click, and most merchants only ever work on the first half. This guide works on the second: the landing page, average order value, checkout, owned email and lifetime value, the store-side levers that raise ROAS without touching your bids.
Every section comes with worked numbers from one example store, so you can redo the math with your own figures in the ROAS calculator.
The ROAS formula, rewritten for your store
The usual formula is ROAS = revenue ÷ ad spend. Break both sides down and something useful appears:
- Revenue = clicks × conversion rate × average order value (AOV)
- Ad spend = clicks × cost per click (CPC)
- So ROAS = (conversion rate × AOV) ÷ CPC
Clicks cancel out. Conversion rate × AOV is your revenue per click: what one paid visitor is worth once they land on your store. The ad account controls CPC; your store controls everything above the line.
Take an example store spending $10,000 a month on ads at $1.00 per click: 10,000 clicks. It converts 2.5% of them (250 orders) at an AOV of $80, so it makes $20,000. Revenue per click is 0.025 × $80 = $2.00, and ROAS is $2.00 ÷ $1.00 = 2.0.
Here is what each lever does with the same $10,000 budget:
Scenario | Conversion rate | AOV | CPC | Revenue per click | ROAS | Monthly revenue |
|---|---|---|---|---|---|---|
Baseline | 2.5% | $80 | $1.00 | $2.00 | 2.00 | $20,000 |
Landing page fix (+10% CVR) | 2.75% | $80 | $1.00 | $2.20 | 2.20 | $22,000 |
Bundles and upsells (+10% AOV) | 2.5% | $88 | $1.00 | $2.20 | 2.20 | $22,000 |
Both store-side levers | 2.75% | $88 | $1.00 | $2.42 | 2.42 | $24,200 |
Ad side only (−10% CPC) | 2.5% | $80 | $0.90 | $2.00 | 2.22 | $22,222 |
Two modest store-side improvements together (+10% conversion, +10% AOV) beat a 10% CPC cut by a wide margin, and they also lift the revenue you get from email, organic and direct traffic, which a cheaper click never does.
Whether 2.0 or 2.42 is a good number depends on your gross margin, not on an industry average: a store with a 50% margin breaks even at a ROAS of 2.0 (1 ÷ 0.5). Use your own margin as the floor, then work on the levers below.
1. Fix the landing page your ads point to
Paid visitors arrive with one idea in their head: the promise in the ad. The page has a few seconds to confirm it.
- Send each ad to the most specific page. An ad for a bestseller goes to that product page, an ad for a range goes to the matching collection. The home page makes the visitor search again.
- Repeat the ad's offer above the fold. If the ad says "2 for $50" or "free shipping", the page must say it too, near the price and the add-to-cart button.
- Put proof next to the button. Star rating, review count, shipping time and return policy belong in the first screen on mobile, not at the bottom of a long description.
- Keep the add-to-cart button in reach. On long mobile pages, a sticky add-to-cart bar keeps the action one tap away.
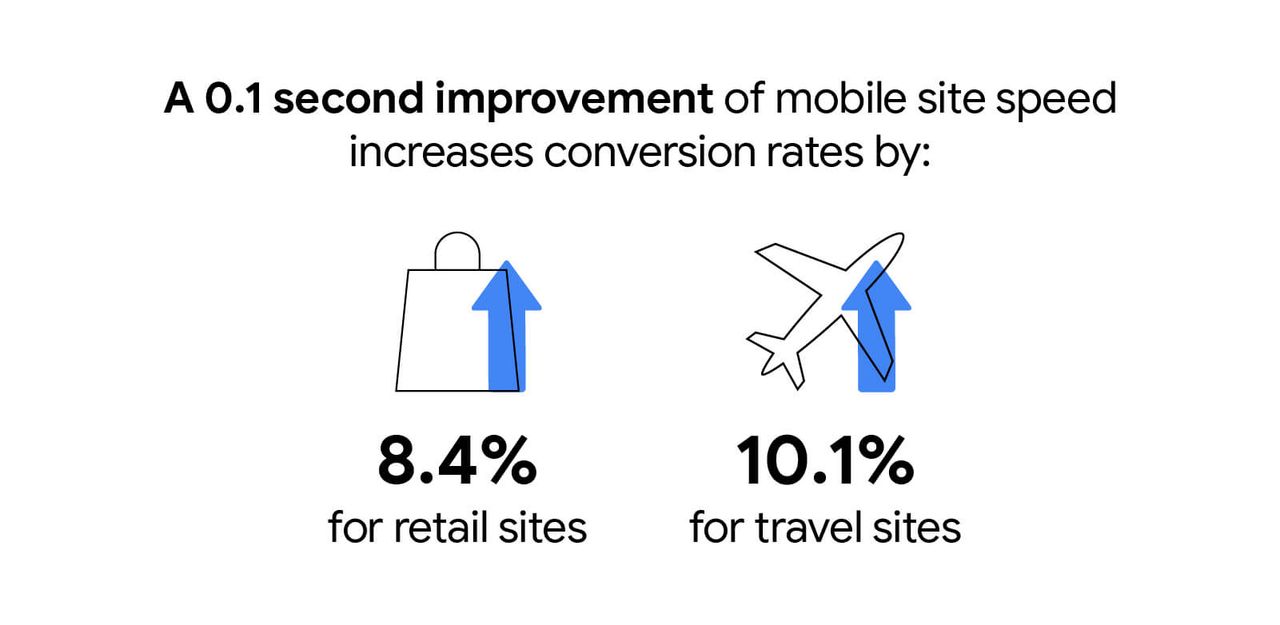
Speed matters as much as layout. In a study run for Google by Deloitte, a 0.1-second improvement in mobile site speed increased conversion rates by 8.4% on retail sites(opens in a new tab). Your store will not see that exact figure, but the direction is clear: every app script and oversized image you load costs paid clicks. Our guide to Shopify speed optimization lists what to remove first.
Worked example. Moving conversion from 2.5% to 2.75% on the example store raises revenue per click from $2.00 to $2.20 (0.0275 × $80). Same budget, same CPC: ROAS goes from 2.0 to 2.2, or $2,000 more revenue a month.
2. Raise AOV with bundles, volume tiers and upsells
AOV is the lever ad platforms can't touch at all. The visitor is already buying; the question is whether they leave with one item or two. The average order value guide covers the full list of tactics. For paid traffic, four placements do most of the work:
- Quantity breaks on the product page. "Buy 2, save 10% / buy 3, save 15%" works for consumables, gifts and anything people use up. See how volume discounts and quantity breaks are set up.
- Fixed bundles of products bought together. A starter kit priced below the sum of its parts gives the visitor a reason to choose the bigger basket.
- Cart upsells and a free shipping goal. A progress bar that shows "$12 away from free shipping" next to a relevant add-on turns the threshold into a nudge. Themes with a cart drawer upsell do this without an extra app.
- A post-purchase offer. Shown after payment, it can't hurt conversion because the first order is already placed. Here is how one-click post-purchase upsells work on Shopify.
Worked example. Say one order in four adds a second unit through a "buy 2, save 10%" tier, worth $32 after the discount. That adds $8 to the average order (0.25 × $32), taking AOV from $80 to $88. Revenue per click becomes 0.025 × $88 = $2.20, and ROAS rises from 2.0 to 2.2.
Check margin before you celebrate: a discounted second unit carries a thinner margin than the first. The extra unit usually still pays, because it costs no extra ad spend, but run the numbers per product rather than discounting everything.
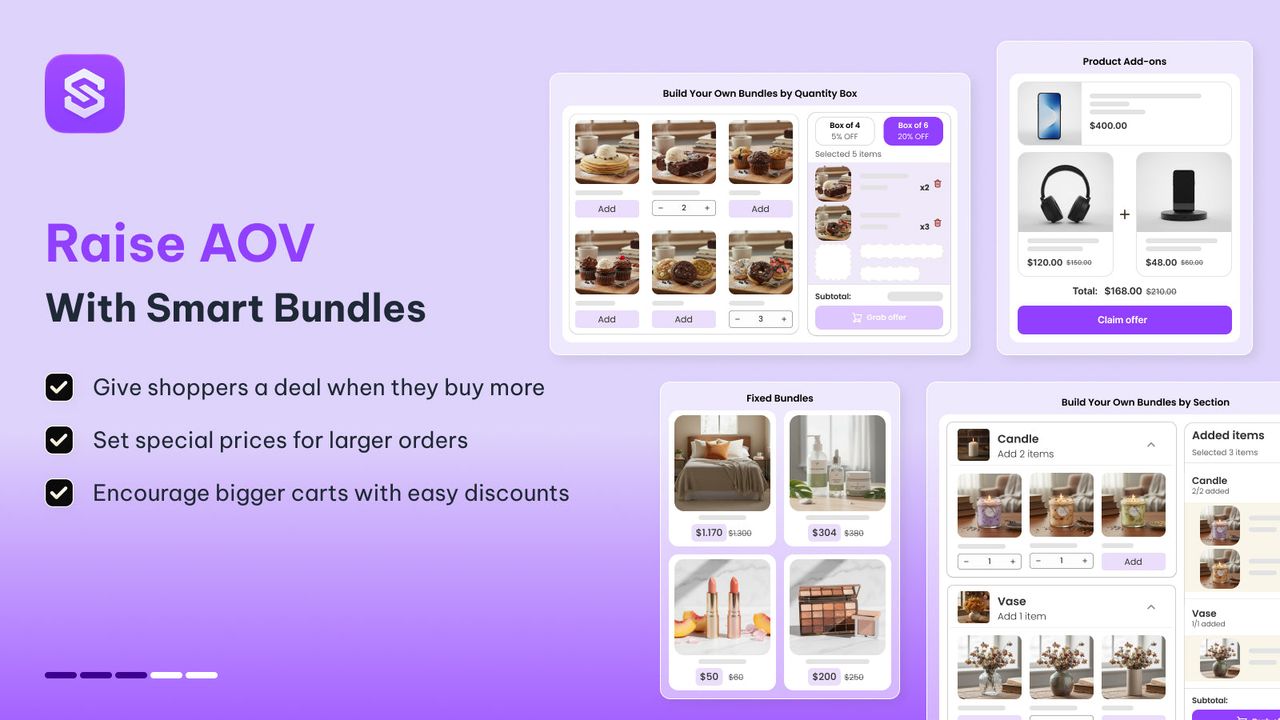
Snap Bundle(opens in a new tab) covers the AOV placements above in one Shopify app: volume discounts, mix and match, fixed bundles, tiered free gifts and build-a-box. It is free while bundle revenue stays under $500 a month, then $12.99 a month, with no cap on orders.
3. Remove friction from checkout
A visitor who reaches checkout has already cost you the click and chosen a product. Losing them there is the most expensive leak in the funnel. Baymard Institute puts the average documented cart abandonment rate at 70.22%(opens in a new tab), based on 50 studies. Among US shoppers who abandoned for a reason other than "just browsing", the top causes were:
Reason for abandoning checkout | Share of US shoppers |
|---|---|
Extra costs too high (shipping, tax, fees) | 40% |
Delivery was too slow | 20% |
Didn’t trust the site with card details | 19% |
The site required creating an account | 18% |
Checkout too long or complicated | 17% |
Couldn’t see the total order cost up front | 12% |
Baymard estimates that the average large ecommerce site could gain a 35.26% increase in conversion rate through better checkout design(opens in a new tab) alone. On Shopify, most of the checkout is standardized, so the fixes are mostly settings:
- Show shipping costs before checkout. Surprise costs are the top reason. State the free shipping threshold and the flat rates on product pages and in the cart.
- Turn on Shop Pay in Settings > Payments. Shopify says that Shop Pay converts as much as 50% better than guest checkout(opens in a new tab), based on a study with a consulting firm. Returning Shop Pay users skip typing their address and card.
- Show express buttons on product pages. Dynamic checkout buttons(opens in a new tab) send mobile visitors straight to Shop Pay, Apple Pay or PayPal from the product page; enable them in your theme editor.
- Never force account creation. Keep sign-in optional so first-time buyers can check out as guests.
- Review your checkout settings(opens in a new tab). Ask only for the fields you need (company name and address line 2 can be optional or hidden), and add trust signals such as your return policy.
The cart page matters too: a slow or confusing cart sends people back to the ad feed. The cart drawer vs cart page comparison explains which suits which catalog.
4. Retarget through email before you pay to retarget
Paid retargeting buys back visitors you already paid for once. Email and SMS reach the same people for nearly nothing, as long as you capture the address.
- Capture contact details early. A sign-up offer (first-order discount, early access) on the landing page turns anonymous paid clicks into contacts you own.
- Run an abandoned checkout flow. Shopify sends one natively, and email tools add timing, product images and a second reminder. Klaviyo reports that abandoned cart flows drive the highest average revenue per recipient of all flows: $6.77 for email(opens in a new tab). Setup and timing are covered in Shopify abandoned cart emails.
- Add browse abandonment and a welcome series, so visitors who never reach checkout still hear from you.
Worked example. Suppose 600 of the example store's paid visitors abandon checkout each month after entering an email. At Klaviyo's average of $6.77 per recipient, the flow brings back about $4,062 (600 × $6.77). Blended over the ad budget, revenue goes from $20,000 to $24,062, a ROAS of about 2.4 on the same $10,000.
Count that revenue once. Ad platforms often claim the same order the email closed, so judge the effect on blended revenue ÷ total ad spend (often called MER), not on the ROAS column inside Meta or Google.
5. Judge ROAS on lifetime value, not on the first order
A first-order ROAS of 2.0 treats every customer as worth one basket. Customers who reorder through email, organic search or a direct visit cost no extra ad spend, so their repeat revenue belongs to the original acquisition.
Worked example. The example store gains 250 new customers a month from ads. If 20% of them place a second order within 12 months at $75, that is 50 repeat orders and $3,750 (50 × $75). The 12-month ROAS of that month's spend is ($20,000 + $3,750) ÷ $10,000 = 2.38, against 2.0 on first orders.
Two things raise that number from the store side:
- Products and offers that invite a second order: refills, consumables, subscriptions, a "complete the set" bundle in the post-purchase email.
- A post-purchase flow that sells, not only informs: a usage tip a week after delivery, a replenishment reminder timed to when the product runs out, then a winback for lapsed buyers.
Track it as a cohort: revenue from customers acquired in a given month, over 30, 90 and 365 days, divided by that month's ad spend. When the 90-day figure is well above the first-order figure, you can afford a higher CPC than competitors who only count the first basket.
The ad-side basics, in brief
The store-side levers work best when the ad account isn't wasting clicks. A short checklist:
- Exclude recent buyers from prospecting audiences so you don't pay to reach existing customers.
- Add negative keywords in Google Ads for searches that click but never buy, and review search terms monthly.
- Clean your product feed: clear titles, correct prices and complete attributes for Shopping and Performance Max.
- Optimize campaigns for purchases, not add-to-carts or landing page views, and send purchase value so bidding knows which orders are worth more.
- Refresh creatives before frequency climbs and click-through rate drops.
Then go back to the store, where the gains compound across every channel.
A 30-day plan to increase ROAS
- Days 1–3: baseline. Note CPC, conversion rate, AOV and revenue per click for paid traffic only. Calculate your break-even ROAS from your gross margin.
- Days 4–10: landing pages. Point each top ad to the most specific page, match the offer above the fold and cut the heaviest scripts.
- Days 11–17: AOV. Add one quantity-break tier or one bundle on your three best-selling products, plus a cart upsell.
- Days 18–24: checkout. Turn on Shop Pay and dynamic checkout buttons, show shipping costs early and trim optional fields.
- Days 25–30: owned retargeting. Launch the abandoned checkout and welcome flows, then compare revenue per click and blended ROAS with your baseline.
Start with revenue per click
ROAS rises when each paid visitor is worth more, and that part of the formula lives in your store. If your first move is AOV, Snap Bundle(opens in a new tab) sets up quantity breaks, bundles and free gift tiers for free until bundle revenue reaches $500 a month.
Before you pull any of these levers, work out the ROAS your store needs just to break even: our break-even ROAS guide shows the formula and how a higher AOV lowers it.
FAQ
How do you increase ROAS without increasing ad spend?
Raise revenue per click, which is conversion rate × AOV. Point ads to specific landing pages, add bundles or quantity breaks, remove checkout friction and recover abandoned checkouts by email. All of these lift ROAS on the same budget.
What is a good ROAS for ecommerce?
A good ROAS is one above your break-even ROAS, which is 1 ÷ gross margin. With a 50% margin you break even at 2.0; with a 25% margin you need 4.0. Industry averages ignore your margin, so start from your own.
Does a higher average order value improve ROAS?
Yes, directly. ROAS = conversion rate × AOV ÷ CPC, so a 10% higher AOV raises ROAS by 10% if conversion rate and CPC hold. Bundles and quantity breaks are the most common way to get there.
How do I improve ROAS in Meta Ads or Google Ads?
On the ad side: exclude recent buyers, optimize for purchases with order value, clean the product feed and add negative keywords. Then fix the landing page and checkout, because the platform can only bring the click.
What is the difference between ROAS and MER?
ROAS usually refers to the revenue an ad platform attributes to its own campaigns. MER (marketing efficiency ratio) is total store revenue ÷ total marketing spend. MER avoids double counting when email and ads claim the same order.
How do I calculate ROAS on Shopify?
Divide revenue from paid traffic by what you spent on those ads over the same period. Our free ROAS calculator does it and shows your break-even ROAS from your margin.
Keep reading

Shopify Free Shipping Threshold: How to Set It to Raise AOV
Pick a free shipping threshold from your order data, check the break-even math, set it up in Shopify (rate or discount), and give shoppers an item that closes the gap.

Repeat Purchase Rate: Formula, Benchmarks and 9 Ways to Raise It
The repeat purchase rate formula, how to find it in Shopify analytics, real benchmarks, and 9 ways to get more second orders without spending more on ads.

Ecommerce Blog: How to Build a Shopify Blog That Actually Sells (2026)
A profitable ecommerce blog answers a problem, then shows the product that solves it. A 6-step method to build a Shopify blog that converts.