
Break-Even ROAS: Formula, Calculator and How to Lower It

Summarize this article with AI


Break-even ROAS is 1 ÷ your contribution margin. The formula, which costs to include, how to set it in Google, Meta, TikTok and Pinterest Ads, and how bundles lower it.
Break-even ROAS is the return on ad spend at which your ads pay for themselves and nothing more: 1 ÷ your contribution margin. If each order keeps 40% of its revenue after product cost, shipping and payment fees, your break-even ROAS is 1 ÷ 0.40 = 2.5. Below 2.5, every order your ads bring in loses money; above it, you earn.
This guide covers the break-even ROAS formula, which costs belong in the margin (most merchants forget half of them), a reference table by margin, and a full worked example for a Shopify store, and how to enter the number in Google Ads, Meta (Facebook and Instagram), TikTok and Pinterest Ads. Then the part most guides skip: how raising the value of each order with bundles and volume tiers lowers your break-even ROAS without changing a cent of ad spend. If you just want the number, plug your figures into the free break-even ROAS calculator and come back for the levers.
What is break-even ROAS?
ROAS (return on ad spend) is the revenue your ads generate divided by what you spent on them. A ROAS of 3 means $3 of sales for every $1 of ads. Google Ads writes the same thing as a percentage: its help center gives the example(opens in a new tab) of $5 in sales for $1 in ad spend, which is a 500% target ROAS.
Break-even ROAS is the specific ROAS where the profit from those sales exactly covers the ad spend. It answers one question: what is the lowest ROAS I can accept before a campaign starts costing me money? Without it, a "3x ROAS" is impossible to judge. For a store with 60% margins it is comfortably profitable; for a store with 25% margins it loses money on every order.
The break-even ROAS formula
There are two ways to write it, and they give the same answer.
Formula 1: 1 ÷ contribution margin
Break-even ROAS = 1 ÷ contribution margin (as a decimal)
Contribution margin = (order revenue − variable costs per order) ÷ order revenue. A 40% margin gives 1 ÷ 0.40 = 2.5. A 25% margin gives 1 ÷ 0.25 = 4.
Formula 2: order value ÷ profit per order
Break-even ROAS = average order value ÷ contribution profit per order
A $50 order that leaves $20 after variable costs has a break-even ROAS of 50 ÷ 20 = 2.5. Same result, since $20 ÷ $50 is a 40% margin. This version is more useful in practice, because it shows the two numbers you can actually move: the order value and the profit inside it.
Its mirror image is break-even CPA: the most you can pay in ads to get one order, which is simply the contribution profit per order ($20 here). Keep that number in mind; it matters in the AOV section below.
Which costs to include (and which to leave out)
The most common mistake is plugging in gross margin from product cost alone. A product that costs $18 and sells for $50 looks like a 64% margin, which suggests a break-even ROAS of 1.56. Once shipping and fees are counted, the real figure is closer to 2.35, as the worked example below shows. Campaigns judged against 1.56 look profitable while losing money.
Include every cost that grows with each extra order:
Cost | Include? | Where to find it |
|---|---|---|
Product cost (COGS), including inbound freight and duties | Yes | Cost per item in Shopify, supplier invoices |
Shipping you pay (including free shipping) | Yes | Shipping labels report, carrier invoices |
Packaging, pick and pack, 3PL fees | Yes | 3PL invoice ÷ orders |
Payment processing (Shopify Payments, PayPal) | Yes | Payouts, Settings > Payments |
Shopify third-party transaction fee | Yes, if you use a third-party gateway | Shopify bill |
Refunds and discounts | Yes, as a % of revenue | Shopify sales reports |
Usage-based app fees (per order or % of revenue) | Yes | App billing |
Shopify plan, theme, flat app fees, salaries | No (fixed) | Cover them with your target ROAS |
Leave out fixed costs that do not change with one more order: your Shopify plan subscription, the theme, salaries, rent, flat monthly app fees. They still have to be paid, which is why you aim above break-even (see target ROAS below), but they do not belong in the per-order margin.
One more check: compare like with like. If the conversion value your ad platform reports includes sales tax or shipping charged to the customer, either strip it out or count it in the formula, because revenue that is not yours inflates the ROAS you see.
How to calculate your break-even ROAS on Shopify
- Record product cost. In your Shopify admin, open Products, click a product, and fill in Cost per item in the Price section. Shopify notes(opens in a new tab) that profit is only reported for products and variants that had a cost recorded when they sold, and that each variant needs its own cost.
- Pull your real margin. Under Analytics > Reports, the profit reports (profit margin by order, gross profit by product and by variant) show gross profit after product cost for a past period.
- Add the per-order costs Shopify does not see. Average shipping label cost per order, packaging, pick and pack, and your payment rate. On Shopify's US pricing page(opens in a new tab), the online standard card rate with Shopify Payments is 2.9% + 30¢ on Basic, 2.7% + 30¢ on Grow and 2.5% + 30¢ on Advanced; with a third-party payment provider, Basic adds a 2% transaction fee.
- Account for refunds and discounts. If 5% of revenue is refunded, your real revenue is 95% of what the ad platform reports.
- Divide. Contribution profit per order ÷ average order value = margin; 1 ÷ margin = break-even ROAS.
The ROAS calculator does steps 3 to 5 for you: enter ad spend, revenue, product cost, shipping, fees, discounts and refunds, and it returns your break-even ROAS, a target ROAS, your break-even CPA and the actual profit left after ads.
Break-even ROAS by margin: reference table
Contribution margin | Break-even ROAS | In Google Ads (%) | Ad spend allowed per $100 of sales |
|---|---|---|---|
20% | 5.00 | 500% | $20 |
25% | 4.00 | 400% | $25 |
30% | 3.33 | 333% | $30 |
35% | 2.86 | 286% | $35 |
40% | 2.50 | 250% | $40 |
50% | 2.00 | 200% | $50 |
60% | 1.67 | 167% | $60 |
70% | 1.43 | 143% | $70 |
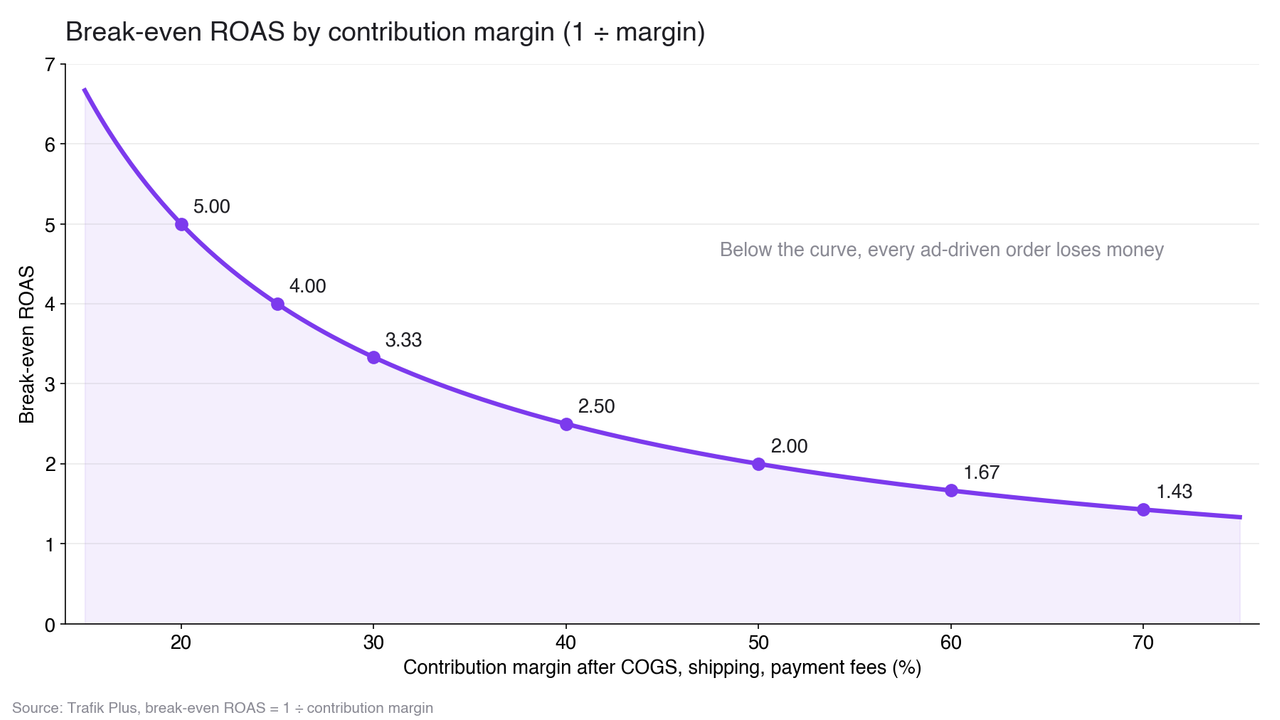
Two things stand out. First, the curve is steep at low margins: going from 20% to 25% margin drops break-even ROAS from 5.00 to 4.00, a whole point. Going from 60% to 70% only moves it from 1.67 to 1.43. Low-margin stores gain the most from every point of margin they recover. Second, there is no universal "good" break-even ROAS. A 2.5 is fine if your margin is 40% and a disaster if it is 25%.
Worked example: a $50 order
Take a store selling a single $50 product, paying for free shipping, on Basic Shopify with Shopify Payments in the US:
Line | Amount |
|---|---|
Order value | $50.00 |
Product cost (COGS) | −$18.00 |
Shipping label (free shipping) | −$7.00 |
Payment fee ( | −$1.75 |
Packaging, pick and pack | −$2.00 |
Contribution profit per order | $21.25 |
Contribution margin ( | 42.5% |
Break-even ROAS ( | 2.35 |
Break-even ROAS = $50 ÷ $21.25 = 2.35 (235% in Google Ads terms). Break-even CPA = $21.25. If the store had used product cost alone (64% margin), it would have believed anything above 1.56 was profitable. A campaign running at 2.0 would look healthy and lose $3.75 on each order: $50 of revenue at ROAS 2.0 means $25 of ads, against $21.25 of contribution.
Target ROAS: break-even is the floor, not the goal
At break-even, ads earn exactly zero. Fixed costs and actual profit still need covering, so set a target ROAS above it:
Target ROAS = 1 ÷ (contribution margin − desired profit margin)
With the 42.5% margin above and a goal of keeping 10% of revenue as profit after ads: 1 ÷ (0.425 − 0.10) = 1 ÷ 0.325 = 3.08. Check: on $100 of revenue, contribution is $42.50, ads at ROAS 3.08 cost $32.50, leaving $10.00. That 3.08 is the number to give your ad platforms: 308% as a Google Ads target ROAS, 3.08 as a Meta ROAS goal or a TikTok minimum ROAS. Each platform takes it differently; see the next section.
Break-even ROAS on Google Ads, Meta, TikTok and Pinterest Ads
Break-even ROAS is the same number on every ad platform, because it comes from your store's margin, not from the channel. The $50 order above breaks even at 2.35 whether the click came from Google, Facebook, Instagram, TikTok or Pinterest. What changes is how each platform takes the number, and which number to give it.
Give the bidding your target ROAS (3.08 here), not break-even. Every platform aims for an average, and an average sitting at break-even means some days and some ad sets lose money. Keep break-even as the floor you check in your weekly review.
Platform | ROAS setting | Break-even | Target |
|---|---|---|---|
Google Ads | Target ROAS bid strategy | 235% | 308% |
Meta Ads (Facebook and Instagram) | ROAS goal | 2.35 | 3.08 |
TikTok Ads | Minimum ROAS (value-based optimization) | 2.35 | 3.08 |
Pinterest Ads | Performance+ ROAS bidding (no number to enter) | Compare reported ROAS to 2.35 | Compare reported ROAS to 3.08 |
Google Ads: target ROAS as a percentage
Google Ads writes ROAS as a percentage, so multiply your ratio by 100: break-even 2.35 × 100 = 235%, target 3.08 × 100 = 308%. Its target ROAS help page(opens in a new tab) asks for at least 15 conversions in the past 30 days on Search and Shopping campaigns, and says Google will try to keep conversion value per cost equal to your target, not above it. Make sure the conversion value Google receives is the revenue your margin was calculated on: without sales tax, and with or without shipping charged to the customer, consistently.
Meta Ads (Facebook and Instagram): the ROAS goal
On Meta, the bid strategy is called ROAS goal(opens in a new tab). It needs maximize value of conversions as the ad set's performance goal, and the value is a multiplier, not a percentage: Meta's own example sets 1.100 to get around $110 of purchases from a $100 budget. For the store above, enter 3.08, never 308. Meta keeps the weekly average near the goal and asks you to wait at least 7 days after a change before judging it, so review against break-even on weekly averages too.
The purchase value Meta optimizes on comes from your pixel and Conversions API. Check what it sends from Shopify: if it includes shipping or tax, compare Meta's ROAS to a break-even calculated on the same basis (see which costs to include above).
TikTok Ads: minimum ROAS with value-based optimization
TikTok's equivalent is the minimum ROAS bid inside value-based optimization for web(opens in a new tab). You choose Purchase as the optimization event and Value as the optimization goal, then enter the return on ad spend you want. Leave the field empty and TikTok uses Highest Value, which spends the budget with no return floor. TikTok says it aims to stay above your minimum ROAS but does not guarantee it.
Value-based optimization only opens once the pixel has at least 20 attributed complete payment events with value and currency over any 7 consecutive days(opens in a new tab). Before that, there is no ROAS field to set: compare the ROAS TikTok reports to your break-even yourself, and send the order value and currency with every Purchase event so the account qualifies.
Pinterest Ads: ROAS bidding with no number to enter
Pinterest has no ROAS field to fill. Pinterest Performance+ ROAS bidding(opens in a new tab) predicts the value of each checkout and adjusts bids on its own. It needs a Sales or Leads objective and checkout events sent with the basket value through the Pinterest tag or Conversions API. On Pinterest, break-even ROAS is the yardstick rather than a setting: if an ad group's reported checkout ROAS stays under 2.35 for a few weeks, cut its budget or test it against standard bidding.
Check the platforms against each other
Each platform counts the sales it can attribute, and a customer who watched a TikTok video and later clicked a Google ad can show up in both dashboards. Add a blended check: Shopify revenue ÷ total ad spend on every platform for the same period, sometimes called MER. It also counts sales the ads did not cause, so it flatters the ads; if even that blended figure sits under break-even while every dashboard shows a ROAS above it, the platforms are counting the same orders twice.
How a bigger order lowers break-even ROAS without touching ad spend
Here is the lever most break-even ROAS guides ignore. Several of your per-order costs are fixed per order, not per item: the shipping label, the box, pick and pack, the 30¢ payment fee. When a customer buys two items in one order, those costs are paid once. The order keeps more of its revenue, the margin rises, and break-even ROAS falls.
The average order value guide covers AOV levers in general; here is the arithmetic for the two that matter most for break-even ROAS, a bundle and a volume tier, using the same $50 product.
The per-offer arithmetic
Assumptions: a 2-pack ships for $8 instead of $7 and costs $2.50 to pack, a 3-pack ships for $9 and costs $3 to pack. Payment is 2.9% + 30¢ on the order total.
Offer | Order value | Variable costs | Contribution (break-even CPA) | Margin | Break-even ROAS |
|---|---|---|---|---|---|
1 item | $50.00 | $28.75 | $21.25 | 42.5% | 2.35 |
2-pack, 10% off | $90.00 | $49.41 | $40.59 | 45.1% | 2.22 |
3-pack, 15% off | $127.50 | $70.00 | $57.50 | 45.1% | 2.22 |
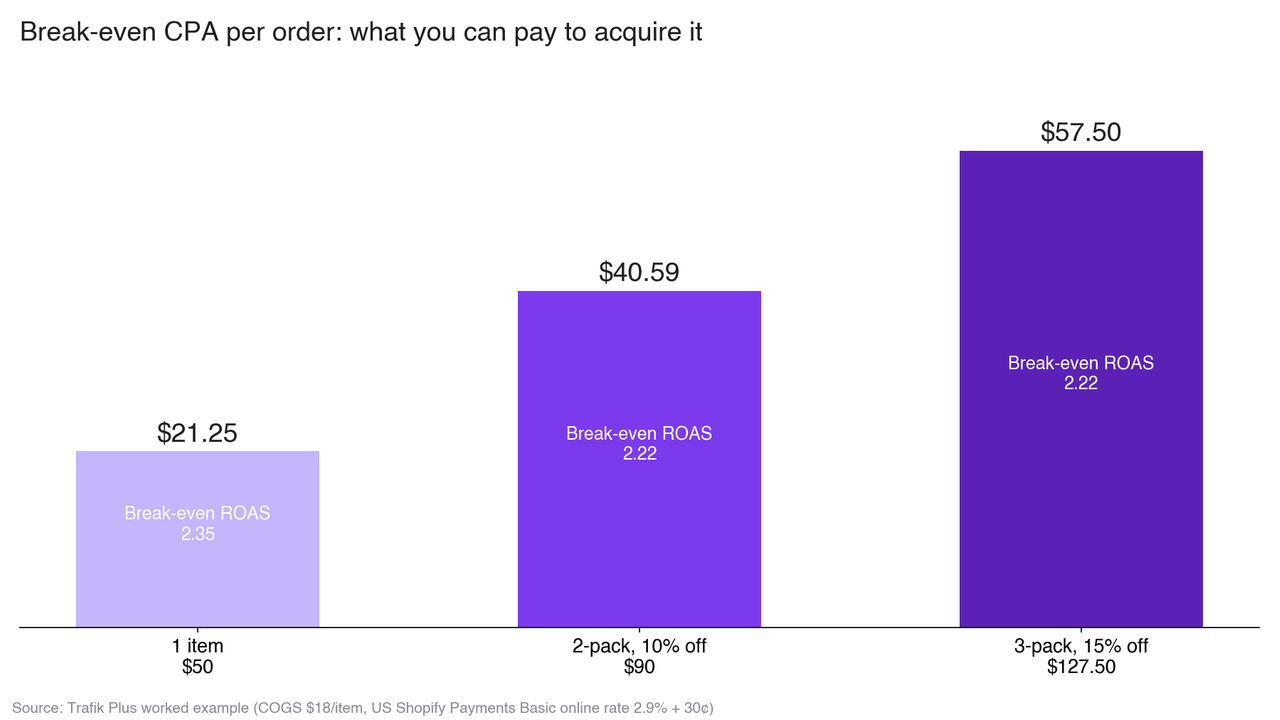
The discounted packs have a slightly lower break-even ROAS (2.22 vs 2.35), but the real story is the break-even CPA: an order you could afford to pay $21.25 for is now worth up to $40.59 or $57.50. The ad that brought the visitor is the same. The click cost is the same. What changed is what that visitor bought.
Same budget, same 200 orders
Say the store spends $5,000 a month on ads and gets 200 orders from them (a $25 CPA).
- Single items only:
200 × $50 = $10,000revenue, ROAS 2.0. Contribution200 × $21.25 = $4,250. After $5,000 of ads: −$750. ROAS 2.0 is below the 2.35 break-even. - 30% of orders take the 2-pack: AOV =
0.7 × $50 + 0.3 × $90 = $62. Revenue200 × $62 = $12,400, ROAS 2.48. Contribution per order =0.7 × $21.25 + 0.3 × $40.59 = $27.05, so200 × $27.05 = $5,410. After $5,000 of ads: +$410.
The blended break-even ROAS is $62 ÷ $27.05 = 2.29, and the campaign now runs at 2.48, above it. Same ads, same budget, same number of customers: a $1,160 swing from loss to profit, only from what sits in the cart. This assumes the bundle does not lower your conversion rate; test it, but a well-placed tier rarely does, because the single item is still there at full price.
Where it backfires: discounting too deep
The margin gain only holds if the discount is smaller than the per-order costs you save. Run the 2-pack at 25% off ($75) instead of 10%: costs are $48.97, contribution is $26.03, the margin drops to 34.7% and break-even ROAS rises to 2.88, worse than the single item. Contribution per order ($26.03) is still a little higher than $21.25, so it is not a disaster, but the gain is mostly gone. Size the discount from your numbers, not from what competitors show. The bundle types and pricing guide covers how to price a bundle without giving the margin away.
Setting it up on Shopify
- Volume tiers ("buy 2, save 10%") on the product page: the simplest version of the table above. See volume discounts and quantity breaks.
- Fixed bundles of complementary products, so the second item is something else the customer needs: frequently bought together bundles.
- A free gift at a quantity tier instead of a deeper discount: a gift that costs you $4 protects margin better than another 10% off. See free gift with a quantity discount.
- A free shipping threshold just above your single-item price, shown with a free shipping progress bar in the cart.
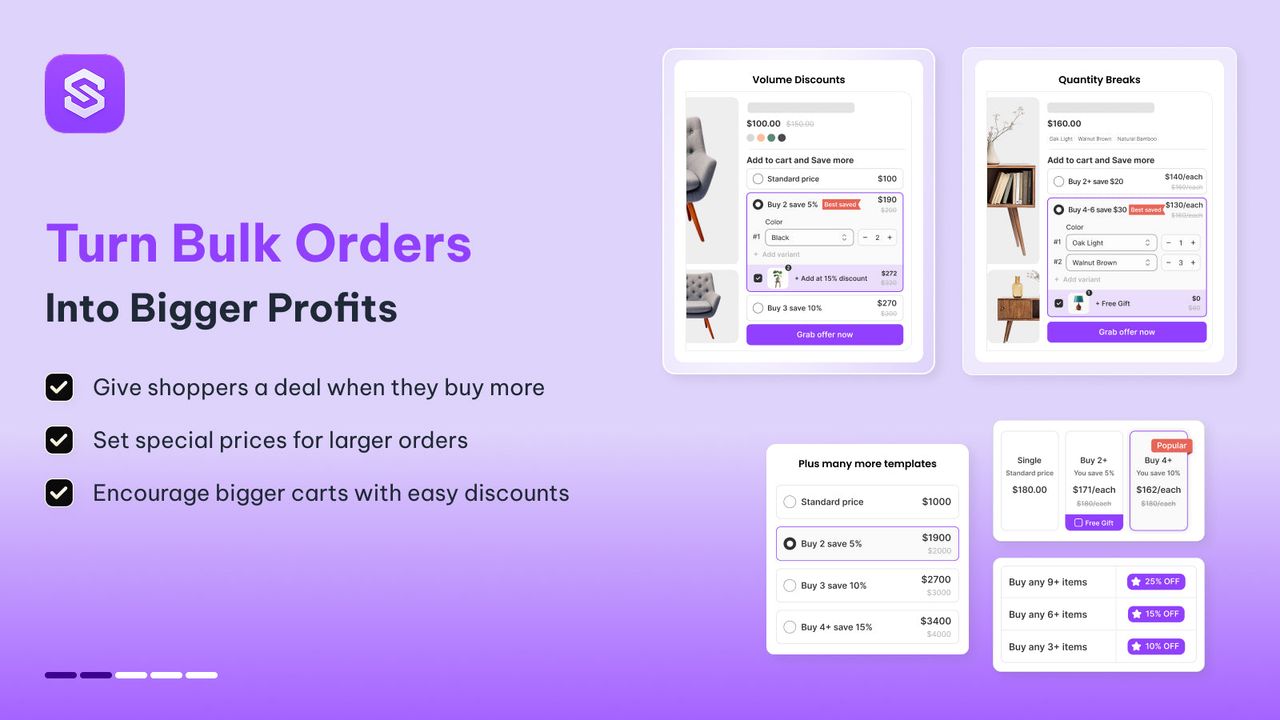
Snap Bundle(opens in a new tab) builds these offers (volume tiers, mix and match, fixed bundles, tiered free gifts, build-a-box) on the product page and in the cart. It is free while bundle revenue stays under $500 a month, then $12.99 a month with no order cap. For a comparison with the other options, see the best Shopify volume discount apps.
Common break-even ROAS mistakes
- Using product margin only. Shipping, fees and packaging can take 20 points of margin or more on a low-priced item, as the $50 example shows.
- Mixing blended and single-product numbers. Your break-even ROAS changes by product. A campaign for a 30% margin product needs 3.33; a 60% product needs 1.67. Calculate per campaign when margins differ.
- Trusting platform-reported ROAS blindly. Google, Meta, TikTok and Pinterest each claim the sales they can attribute, and their windows overlap. Compare their numbers to Shopify's orders before deciding a campaign is above break-even.
- Forgetting repeat purchases. First-order break-even ROAS is the strict test. If a share of customers reorders, a first-order ROAS slightly below break-even can still be profitable over time; just make that a deliberate decision based on your own repeat rate, not a hope.
- Only fixing it on the ad side. Lower CPMs and better creative help, but the margin and the order value are numbers you control fully, in your own store. The guide on how to increase ROAS from the store side covers the conversion and AOV levers in detail.
Lower the bar instead of chasing it
Your break-even ROAS is set by what each order is worth to you, not by your ad account. Work out the real number with the ROAS calculator, then raise what each visitor buys with a volume tier or a bundle; Snap Bundle(opens in a new tab) is free to start until bundles bring in $500 a month.
FAQ
What is a good break-even ROAS?
There is no universal good number, because break-even ROAS is 1 ÷ your margin. A lower one is better, since it means each order leaves more room for ad spend: 2.0 or below (50%+ margin) gives a lot of headroom, 4.0 or above (25% margin or less) makes paid acquisition hard. What matters is that your actual ROAS sits above your own break-even, ideally at your target ROAS.
How do I calculate break-even ROAS?
Add up every variable cost of an average order (product cost, shipping, packaging, payment fees, refunds), subtract it from the order value to get contribution profit, then divide the order value by that profit. A $50 order with $21.25 of contribution has a break-even ROAS of
50 ÷ 21.25 = 2.35. The ROAS calculator does it for you.Is break-even ROAS the same as target ROAS?
No. Break-even ROAS is the point where ads earn zero profit. Target ROAS adds the profit you want to keep: 1 ÷ (contribution margin − desired profit margin). With a 42.5% margin and a 10% profit goal, break-even is 2.35 and target is 3.08.
What is break-even ROAS for Facebook, TikTok or Pinterest ads?
The same as for Google Ads: 1 ÷ contribution margin, because it depends on what each order leaves you, not on the channel that brought it. Only the format changes. A 2.35 break-even is 235% in Google Ads, 2.35 as a Meta ROAS goal or a TikTok minimum ROAS, and on Pinterest, where ROAS bidding takes no number, it is the figure you compare reported ROAS against.
Should I set my Meta ROAS goal or TikTok minimum ROAS at break-even?
No. Set it at your target ROAS, which leaves room for fixed costs and profit. Both platforms aim for an average return, and an average at break-even means part of the spend loses money. Use break-even as the floor in your weekly review: an ad set that stays under it is losing money on every order.
Should Shopify fees be included in break-even ROAS?
Include the fees charged per order: payment processing (for example 2.9% + 30¢ on Basic with Shopify Payments in the US) and the third-party transaction fee if you use another gateway. Leave out the monthly plan price, which is a fixed cost covered by your target ROAS.
What is a typical break-even ROAS for dropshipping?
Dropshipping margins are usually thinner because product cost and shipping are both paid to the supplier, so break-even ROAS tends to be high. At a 25% contribution margin it is 4.0; at 30% it is 3.33. Calculate it from your own supplier prices rather than relying on a rule of thumb.
How can I lower my break-even ROAS without spending more on ads?
Raise the profit in each order: cut variable costs (shipping rates, packaging, payment method) or increase what each customer buys with volume tiers, bundles and free gift tiers, which spread fixed per-order costs over more items. Keep the discount smaller than the costs you save, or the margin falls. See volume discounts.

Keep reading

Average Order Value: Formula, Calculation Examples and 12 Ways to Increase It
Average order value is revenue divided by orders. The formula with worked examples, where Shopify shows AOV, and 12 ways to raise it, from tiered discounts to post-purchase upsells.

Bundle Pricing: How to Price a Bundle Without Losing Margin
How to price a bundle with real margin math: the price floor formula, discount depth by margin, cannibalization break-even, volume tiers and mix-and-match rules.

16 Best Kombucha Shopify Store Examples (Desktop + Mobile)
16 real kombucha brands on Shopify, from Kyo and Health-Ade to GT's and Remedy: home pages, product pages, pack pickers and subscriptions on desktop and mobile, with the theme each store uses.