
Average Order Value: Formula, Calculation Examples and 12 Ways to Increase It

Summarize this article with AI


Average order value is revenue divided by orders. The formula with worked examples, where Shopify shows AOV, and 12 ways to raise it, from tiered discounts to post-purchase upsells.
AOV stands for average order value: how much a customer spends, on average, each time they place an order. It is one of the three numbers that make up an online store's revenue, alongside traffic and conversion rate, and it is usually the cheapest of the three to move.
This guide covers what AOV means, how to calculate it with worked examples, where to find it in Shopify, and the 12 levers we see work most often on Shopify stores. Disclosure: we make Snap Bundle and the Cama and Pops themes, which handle several of these levers.
What does AOV mean in ecommerce?
Average order value is the mean value of the orders placed over a period: a day, a month, a campaign. If 100 orders brought in $6,000 last month, your AOV was $60.
It matters because revenue is traffic × conversion rate × AOV. Getting more traffic costs ad money; raising conversion takes design and testing. Raising AOV means selling more to people who are already buying, and the marginal cost of a second item in the same box is low: one shipment, one payment fee, one acquisition cost.
The AOV formula
AOV = total revenue ÷ number of orders
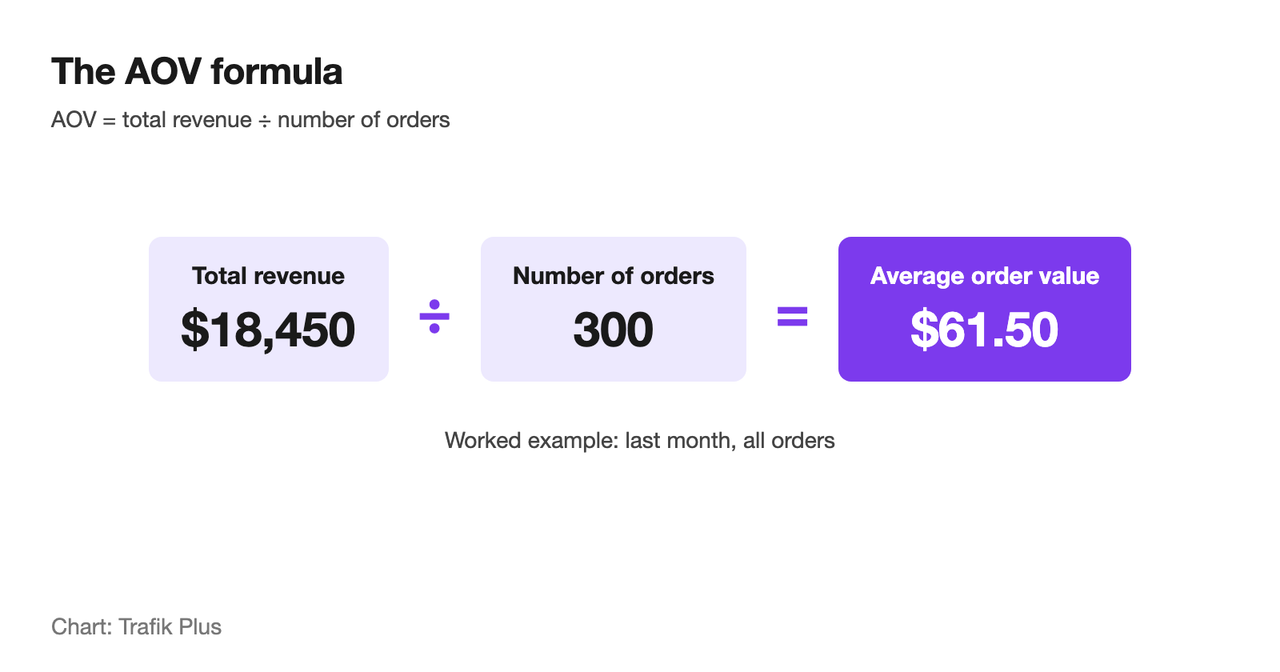
Two details keep the number honest:
- Use one revenue definition and stick to it. Most teams use net sales (after discounts and returns), excluding shipping and taxes. Mixing gross and net between months makes AOV move when nothing changed.
- Read it with the order count. AOV can rise because small orders disappeared. Here is the same revenue with fewer, larger orders:
Month A | Month B | |
|---|---|---|
Revenue | $24,000 | $24,000 |
Orders | 400 | 320 |
AOV | $60 | $75 |
Orders to ship and pay fees on | 400 | 320 |
Month B is better: the same revenue from fewer shipments and fewer payment fees, and usually a better return on ad spend. Our ROAS calculator shows how a higher AOV changes the break-even point of your campaigns.
How to calculate average order value: worked examples
Pick a period, take the revenue for that period and divide it by the number of orders placed in it. The same formula answers different questions depending on which orders you include:
What you measure | Revenue | Orders | AOV |
|---|---|---|---|
Last month, all orders | $18,450 | 300 | $61.50 |
Black Friday weekend | $9,800 | 112 | $87.50 |
Returning customers only, last month | $7,200 | 90 | $80.00 |
The last row is often the most useful: if returning customers spend $80 and the store average is $61.50, first orders are pulling the average down, and the levers below are worth testing on new visitors first.
Gross vs net AOV
Say the same month had $20,000 of gross sales, $1,500 of discounts and $500 of returns over 300 orders. Gross AOV is $20,000 ÷ 300 = $66.67. Net AOV is ($20,000 − $1,500 − $500) ÷ 300 = $60.00. Both are correct; they are just different numbers. Check which one a report uses before comparing it with another tool or with last year.
What a higher AOV is worth
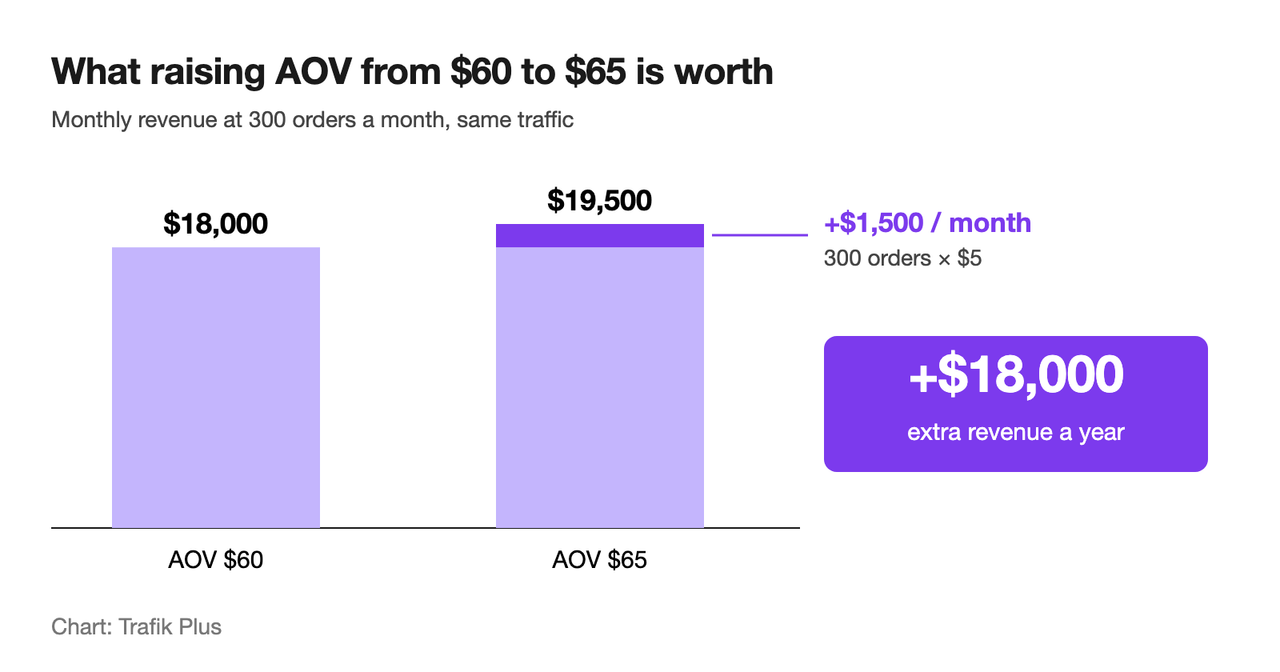
Multiply the increase by your order count. At 300 orders a month, raising AOV from $60 to $65 adds 300 × $5 = $1,500 of revenue a month, or $18,000 a year, with no extra traffic. The same arithmetic sets a free shipping threshold: with a $60 AOV, a threshold 15–30% higher lands between $69 and $78.
Where to find average order value in Shopify
In Shopify admin, open Analytics. The overview dashboard shows Average order value for the period you pick, and you can compare it with the previous period. For more detail, open the reports and break AOV down by sales channel, by new vs returning customers, or by product. Look at mobile and desktop separately as well: the gap is often large.
12 ways to increase average order value on Shopify
1. Tiered volume discounts
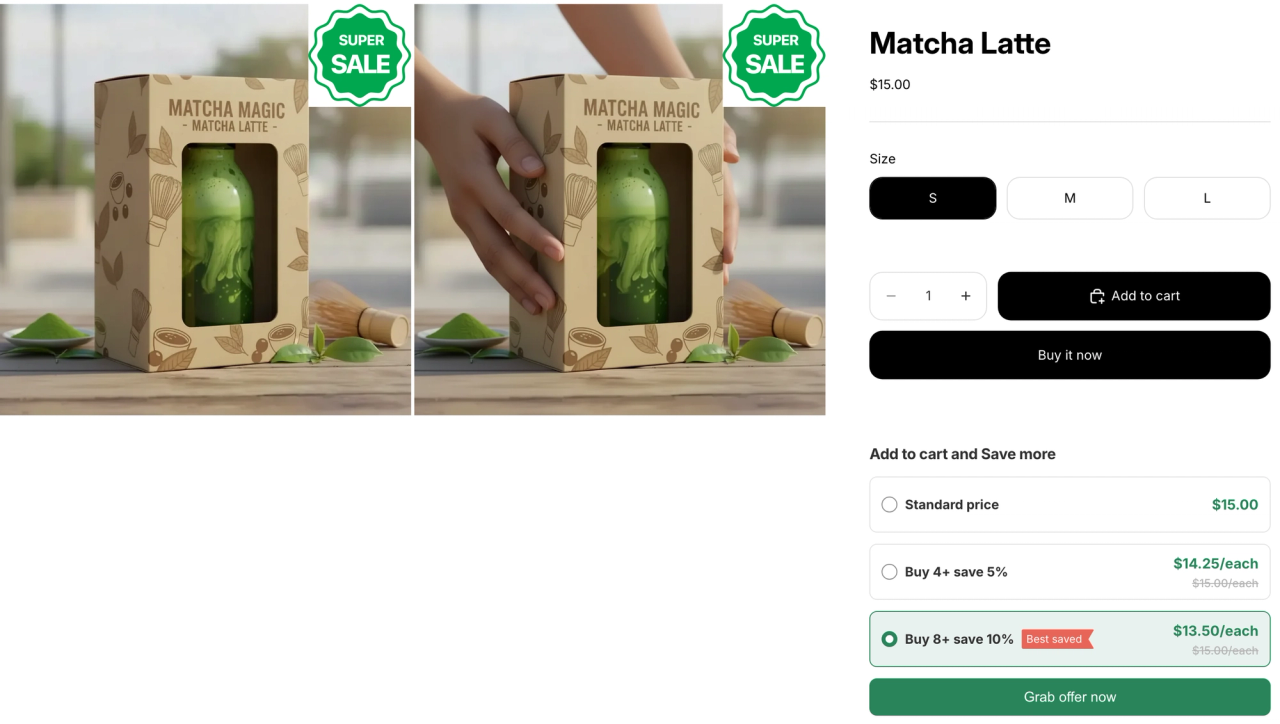
"Buy 2, save 10% · Buy 3, save 15%" shown right under the price. It is the most direct AOV lever for products bought in multiples. See volume discounts and our comparison of volume discount apps.
2. Fixed bundles of products used together
Shampoo + conditioner, camera + memory card. A frequently bought together bundle works when the pairing is obvious. Our guide to ecommerce bundles covers the types.
3. Mix-and-match and build-a-box
For catalogs with many flavours or variants, let customers pick any 3 or 6 items for a set price: mix-and-match bundles or a build-a-box.
4. A free shipping threshold, shown as a progress bar
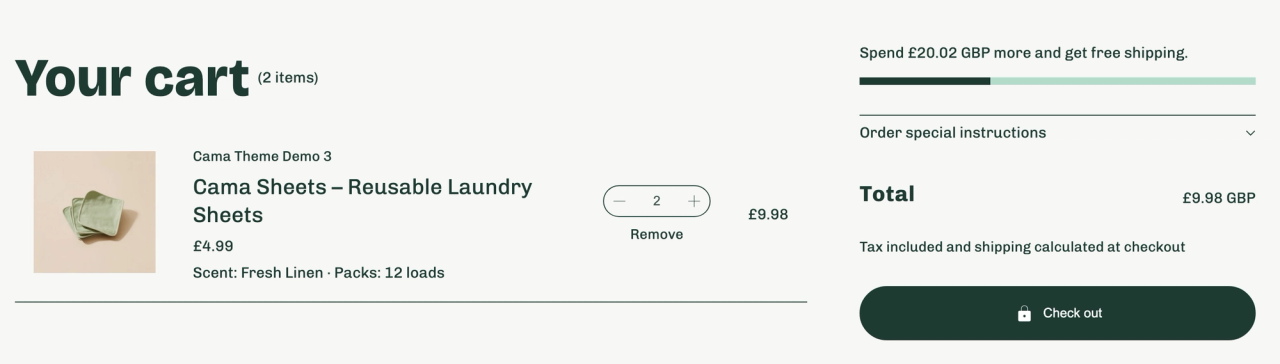
Set the threshold 15–30% above your current AOV and show the remaining amount in the cart: "You're $12 away from free shipping." A free shipping bar turns an abstract rule into a goal.
5. A free gift at a threshold
"Free tote bag from 3 items." Gifts often feel more generous than an equivalent discount and cost you less. See free gift with quantity discount.
6. A cart upsell people actually see
An upsell only works if shoppers see it. A single, relevant add-on placed in plain view in the cart (gift wrap, batteries, a case) does more than a carousel nobody scrolls. See cart upsell.
7. Product add-ons on the product page
Engraving, extended warranty, gift message: product add-ons raise order value at the moment of decision, without a second product page.

8. Complementary products
A short "Pairs well with" row of complementary products helps customers finish the job they came for.
9. Post-purchase upsells
The customer has already paid; a one-click offer on the thank-you page adds to the order without risking the checkout. See post-purchase upsell.
10. A comparison table for your premium option
If a higher-priced product is genuinely better, show why with measurable facts side by side (capacity, battery life, warranty) rather than a list of features. A comparison table block does this natively in some themes.
11. A clear total in the cart
Surprises at checkout kill larger carts first: extra costs that are too high (shipping, taxes, fees) are the top reason shoppers give for abandoning a checkout, cited by 40% of them in research by the Baymard Institute(opens in a new tab). Show the full price in the cart and say so in one line under the total: "That's the final figure. Nothing else is added at checkout."
12. Bigger pack sizes as the default
When a product comes in sizes, put the best-value size first, with the price per unit visible. Many customers keep the default.
Which AOV lever to start with
Lever | Where it shows | Best for |
|---|---|---|
Tiered volume discount | Product page | Consumables, basics, gifts bought in multiples |
Fixed bundle | Product page | Products that are used together |
Mix-and-match / build-a-box | Product or bundle page | Catalogs with many variants or flavours |
Free shipping threshold | Cart, announcement bar | Almost every store |
Free gift at a threshold | Product page, cart | Seasonal campaigns, BFCM |
Cart upsell | Cart drawer | Accessories, protection, gift wrap |
Post-purchase upsell | After payment | Refills, second units, add-ons |
If you can only do one thing this month, start with the lever closest to the purchase decision: a tier or bundle on your best-selling product page, then a free shipping bar in the cart. Measure AOV and conversion rate together for two to four weeks before adding the next lever.
Tools for raising AOV on Shopify
- Theme features first. Cama and Pops include a free shipping bar, cart upsells and complementary products without an app. See all features for increasing AOV.
- One app for offers. Snap Bundle(opens in a new tab) covers volume discounts, bundles, mix-and-match, free gifts, product add-ons and post-purchase upsells. It is free up to $500 a month of revenue generated through the app, then $12.99/month.
FAQ
What does AOV mean?
AOV stands for average order value: the average amount a customer spends per order over a given period. It is revenue divided by the number of orders.
What is the AOV formula?
AOV = total revenue ÷ number of orders. Use the same revenue definition every time (for example, net sales after discounts and returns, excluding shipping and tax) so periods stay comparable.
What is a good average order value?
There is no universal number: it depends on your prices and category. Compare your AOV with your own past months and with the cost of acquiring a customer. For reference, Shopify reported an average cart of $114.70(opens in a new tab) across its merchants during Black Friday Cyber Monday 2025.
Where can I see AOV in Shopify?
In Shopify admin, go to Analytics. The overview shows average order value, and the reports let you break it down by channel, product or customer type.
Is raising AOV better than raising conversion rate?
They work together. AOV levers that add friction (a long quiz, five upsells) can lower conversion; the best ones, like a free shipping bar or a tier on the product page, raise both.

Keep reading

Break-Even ROAS: Formula, Calculator and How to Lower It
Break-even ROAS is 1 ÷ your contribution margin. The formula, which costs to include, how to set it in Google, Meta, TikTok and Pinterest Ads, and how bundles lower it.

Bundle Pricing: How to Price a Bundle Without Losing Margin
How to price a bundle with real margin math: the price floor formula, discount depth by margin, cannibalization break-even, volume tiers and mix-and-match rules.

16 Best Kombucha Shopify Store Examples (Desktop + Mobile)
16 real kombucha brands on Shopify, from Kyo and Health-Ade to GT's and Remedy: home pages, product pages, pack pickers and subscriptions on desktop and mobile, with the theme each store uses.