
Ecommerce Metrics: 7 KPIs to Grow Revenue Without More Ad Spend

Summarize this article with AI


The 7 ecommerce metrics that matter on a fixed ad budget: formulas, the Shopify report for each, verified benchmarks and the lever that moves it.
Ecommerce metrics are the numbers that show how well your store turns visits into revenue and profit. If you won't raise ad spend, seven matter most: conversion rate, average order value (AOV), revenue per visitor, gross margin, repeat purchase rate, customer lifetime value (LTV) and cart abandonment rate. Each one is a lever you can pull on traffic you already pay for.
This guide gives the formula for each KPI, the exact Shopify report where you find it, what "good" looks like (only benchmarks we could verify), and the change that moves it. A comparison table sits in the middle if you want the short version.
Why these ecommerce KPIs, and not the usual list
Most lists of ecommerce KPIs mix in ad metrics: CPC, CTR, ROAS, cost per acquisition. Those matter, but they measure how efficiently you buy traffic. When the budget is fixed, the question changes to: how much is each visitor and each customer worth once they arrive?
Revenue on a fixed budget breaks down like this:
- Revenue = sessions × conversion rate × average order value
- Profit = revenue × gross margin − fixed costs
- Long-term value = first order + repeat orders, which is where lifetime value and repeat purchase rate come in
Sessions are the term you are choosing not to buy more of. Everything else in those lines is on your side of the counter: the store, the offer, the cart, the follow-up email.
A worked example
Take a store with 10,000 sessions a month, a 1.4% conversion rate and a $60 average order value.
- Orders: 10,000 × 1.4% = 140
- Revenue: 140 × $60 = $8,400
- Revenue per visitor: $8,400 ÷ 10,000 = $0.84
Now raise AOV by 10% to $66: 140 × $66 = $9,240, or $840 more. Raise conversion rate by 10% instead, to 1.54%: 154 orders × $60 = $9,240, the same gain. Do both: 154 × $66 = $10,164, which is 21% more revenue from the same traffic and the same ad bill. The gains multiply because the levers do.
Conversion rate
Formula: orders ÷ sessions × 100.
Where in Shopify: go to Analytics > Reports and filter by the Behavior category. The Conversion rate breakdown report(opens in a new tab) shows the funnel: all sessions, sessions with cart additions, sessions that reached checkout, sessions that completed checkout. Shopify calculates each step as sessions at that step divided by total sessions. Conversion rate over time shows the trend.
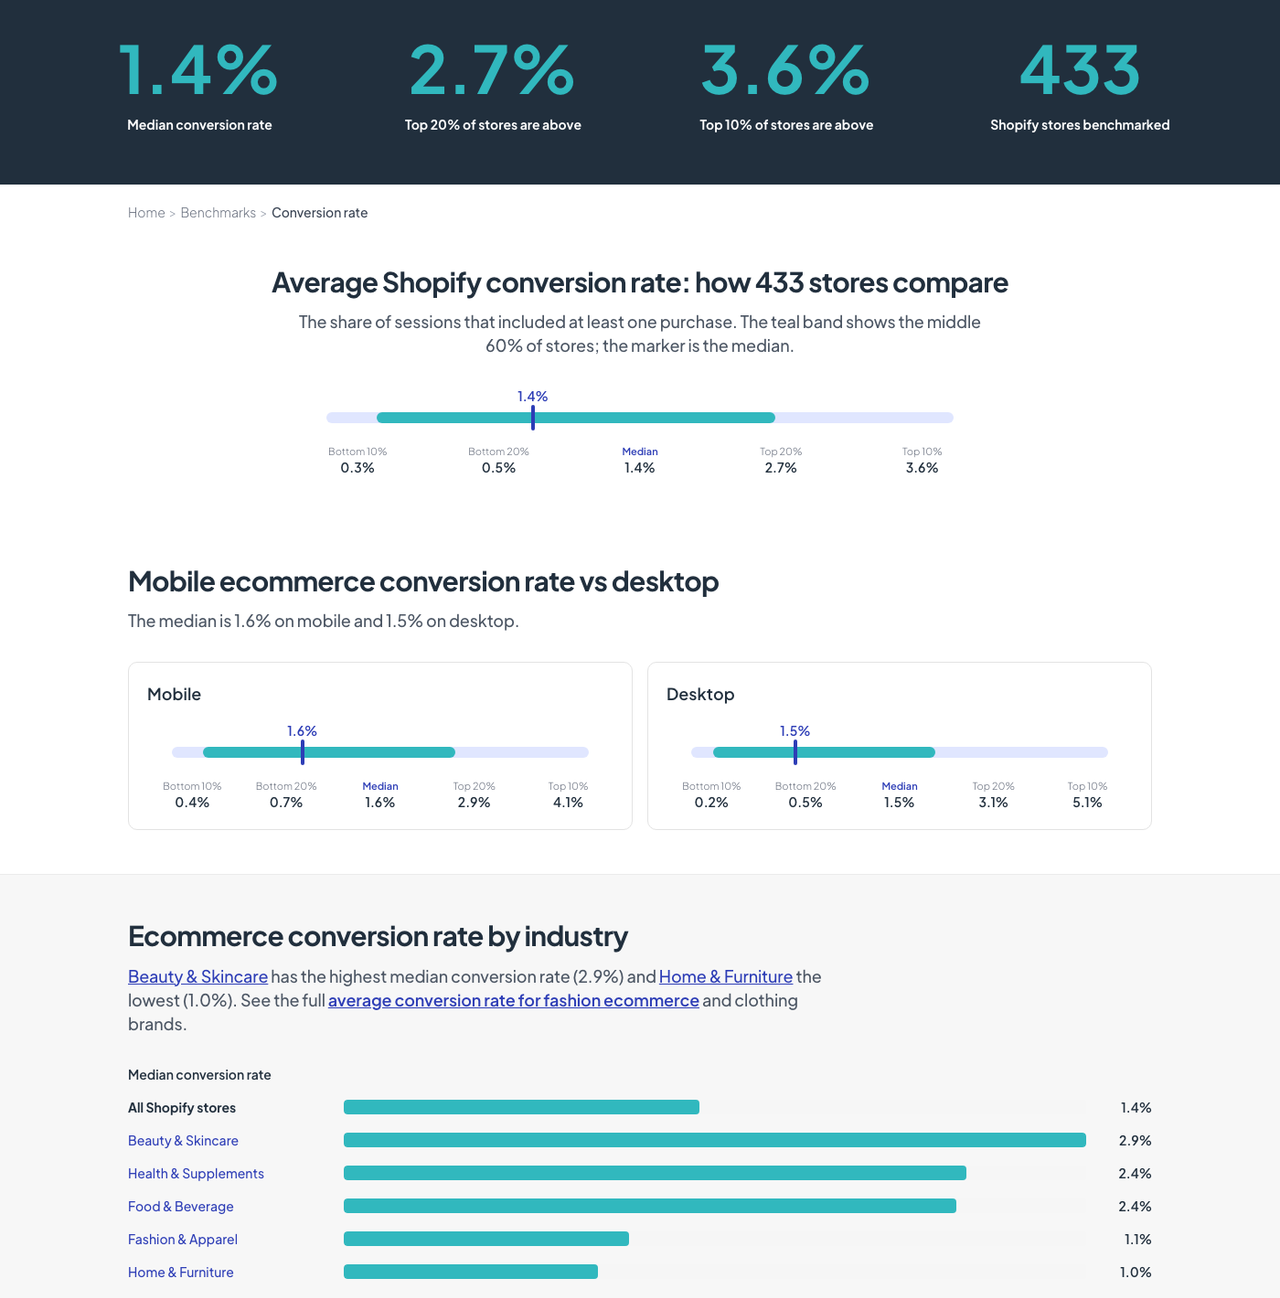
What good looks like: Littledata's benchmark of 433 Shopify stores(opens in a new tab) (90 days to October 17, 2026) puts the median at 1.4%, with the top 20% above 2.7% and the top 10% above 3.6%. Category moves the bar a lot: beauty and skincare had a 2.9% median, home and furniture 1.0%. Compare yourself with your category and, above all, with last month.
The lever: conversion rate rises when you remove reasons to leave, not when you add pop-ups. The funnel report tells you where to look:
- Low add-to-cart rate: the product page is the problem. Check price clarity, photos, reviews near the buy button, and stock and delivery information above the fold.
- Carts that never reach checkout: the cart is the problem. Unexpected costs and a slow or cluttered cart are the usual causes. Our comparison of cart drawer vs cart page covers which layout suits which store.
- Checkouts that don't complete: payment options, forced account creation, or shipping costs revealed too late.
Average order value (AOV)
Formula: Shopify defines AOV as (gross sales − discounts) ÷ orders(opens in a new tab), excluding post-order edits and exchanges.
Where in Shopify: Analytics > Reports > Average order value over time, in the Sales category. Group it by week or month and compare date ranges.
What good looks like: Littledata's AOV benchmark(opens in a new tab) shows a $111 median across the same 433 Shopify stores, with the top 20% above $290 and the bottom 20% below $60. That spread mostly reflects what stores sell (a sofa shop and a snack shop will never match), so treat your own trend as the real benchmark.
The lever: give shoppers a reason to add a second item. Bundles, quantity breaks and a free shipping threshold set slightly above your current AOV are the three that work without extra traffic. We cover the full calculation and 12 tactics in our guide to average order value, so we won't repeat them here.
Revenue per visitor (RPV)
Formula: revenue ÷ sessions. It is also conversion rate × AOV, which is why it is the best single number for a store that won't buy more traffic: it catches the trade-off between the two. A discount that lifts conversion but cuts AOV shows up here as flat or down.
Where in Shopify: there is no default report with this name. Take total sales from Total sales over time and divide by sessions from Sessions over time (Acquisition category) for the same date range. A custom exploration with both metrics saves you the spreadsheet.
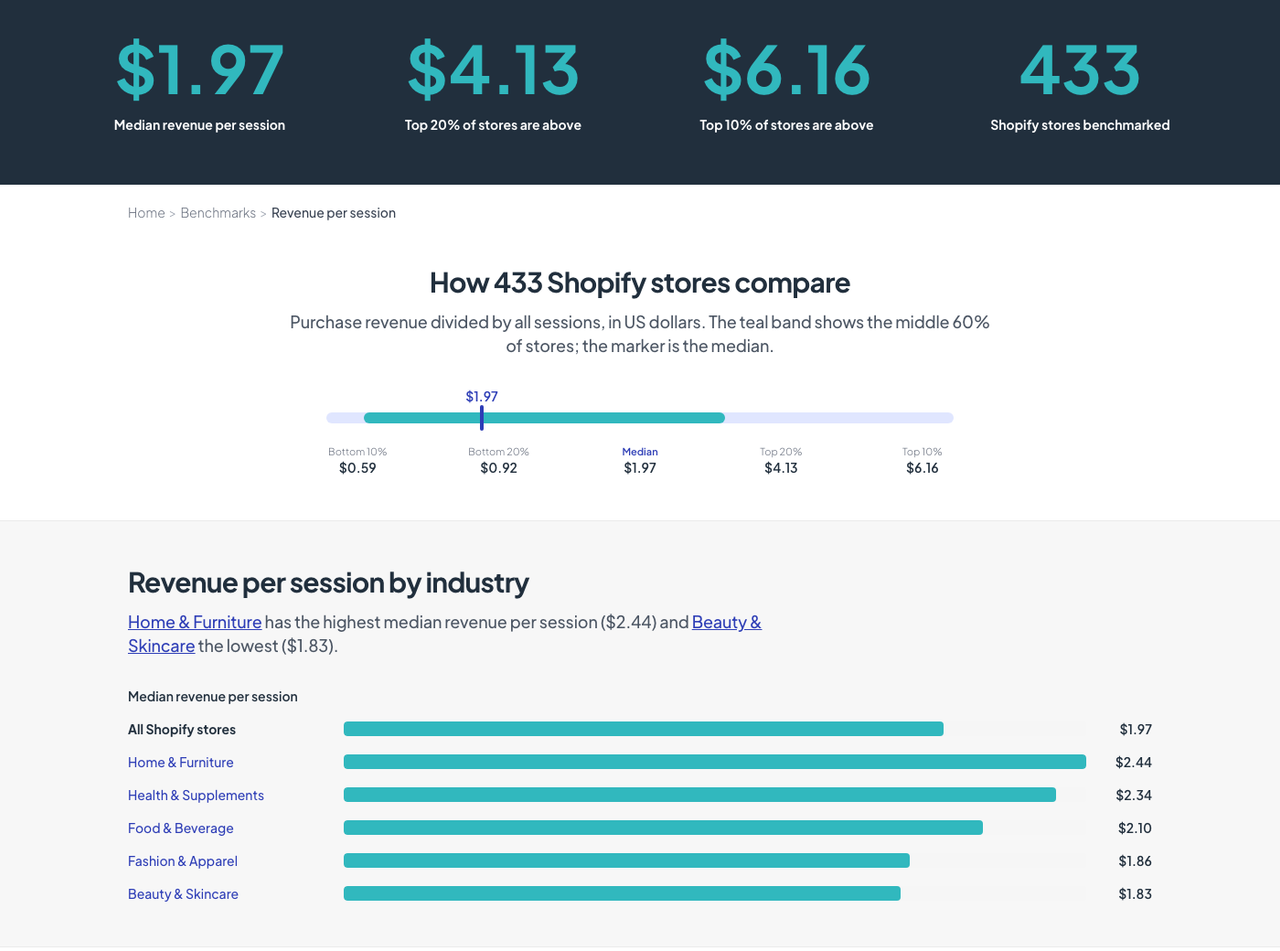
What good looks like: Littledata measures revenue per session(opens in a new tab) at a $1.97 median for Shopify stores, with the top 20% above $4.13. Note it counts sessions, not unique visitors, which is how most tools calculate RPV in practice.
The lever: anything that moves conversion rate or AOV without hurting the other. Run promotions as tests and judge them on RPV, not on orders alone.
Comparison table: the seven ecommerce metrics at a glance
Metric | Formula | Where in Shopify | Benchmark (verified) | Main lever |
|---|---|---|---|---|
Conversion rate | Orders ÷ sessions | Conversion rate breakdown, Conversion rate over time | Median 1.4%, top 20% above 2.7% (Littledata, Oct 2026) | Remove friction: costs shown early, fast cart, trust |
Average order value | (Gross sales − discounts) ÷ orders | Average order value over time | Median $111, top 20% above $290 (Littledata) | Bundles, volume discounts, free shipping threshold |
Revenue per visitor | Revenue ÷ sessions (= CVR × AOV) | Total sales ÷ sessions (no single report) | Median $1.97, top 20% above $4.13 per session (Littledata) | Any lever on CVR or AOV |
Gross margin | (Revenue − COGS) ÷ revenue | Profit reports (needs cost per item) | No reliable cross-store figure: depends on category | Pricing, bundles instead of sitewide discounts |
Repeat purchase rate | Customers with 2+ orders ÷ all customers | Returning customers, New vs returning customers | Varies by category: track your own cohorts | Post-purchase flows, replenishment, subscriptions |
Customer lifetime value | AOV × orders per customer × gross margin | Customer cohort analysis (projections), Predicted spend tier | Compare with your acquisition cost, not other stores | Repeat rate and AOV together |
Cart abandonment rate | (Carts − orders) ÷ carts | Conversion rate breakdown funnel, Orders > Abandoned checkouts | 70.22% average (Baymard, 50 studies); Shopify median 78% (Littledata) | Show costs early, recovery emails |
Gross margin
Formula: (revenue − cost of goods sold) ÷ revenue × 100. If you want a truer figure, subtract shipping you pay, payment fees and packaging too: that gives you contribution margin.
Where in Shopify: the profit reports(opens in a new tab): Gross profit by product, Gross profit by product variant and Profit margin by order. They only work if you fill in Cost per item on each product and variant; Shopify reports profit only for items that had a cost recorded when they sold. Profit and customer reports are included from the Grow plan(opens in a new tab).
What good looks like: there is no reliable cross-store benchmark, because margins depend on category and on whether you make or resell products. What matters is the margin on each product and how discounts eat it.
Why it matters without ad spend: margin decides how much you can give away to win a bigger order, and it sets your break-even ROAS (1 ÷ gross margin: at a 60% margin you need $1.67 of revenue per $1 of ads). Plug your own numbers into our ROAS calculator.
The lever: stop discounting the whole catalog. On a $100 product that costs $40, a 10% sitewide discount drops gross profit from $60 to $50 per unit, so you need 20% more units just to stand still. A bundle protects margin better: three $30 items that cost $12 each sold together at 10% off bring $81 in revenue and $45 in gross profit per order, against $18 for a single item, and you ship one box instead of three.
Repeat purchase rate
Formula: customers with two or more orders ÷ all customers, over a fixed period. Shopify's own guide(opens in a new tab) uses the same formula. Example: 1,000 customers bought in the last 12 months and 220 of them ordered at least twice: 22%.
Where in Shopify: in the Customers reports(opens in a new tab), Returning customers lists everyone with two or more orders, One-time customers lists the rest, and New vs returning customers shows the split over time.
What good looks like: published repeat-rate benchmarks are mostly vendor data with different time windows, and the gap between a coffee brand and a mattress brand is huge. Track your own rate by first-order month instead (cohort analysis, below) and aim to beat last year's cohorts.
The lever: the second order is the hard one. Send a post-purchase email timed to when the product runs out, offer a refill or a subscribe-and-save option (see our guide to increasing sales with subscriptions), and put a reason to come back in the parcel.
Customer lifetime value (LTV)
Formula (simple version): AOV × orders per customer over a period × gross margin. With a $60 AOV, 1.4 orders per customer in 12 months and a 60% margin: $60 × 1.4 × 0.6 = $50.40 of gross profit per customer per year. Push orders per customer to 1.5 and that becomes $54, without one more ad dollar.
Where in Shopify: Customer cohort analysis groups customers by the month of their first order and shows retention and spend over time. Choose Amount spent per customer as the metric and turn on Show projections to see predicted spend per cohort; Shopify only shows this when it has 24 months of data(opens in a new tab). The Predicted spend tier report ranks individual customers by predicted value, which is handy for building a VIP segment.
What good looks like: compare LTV with what it costs you to win a customer, not with other stores. If gross-profit LTV over 12 months doesn't cover your acquisition cost, you are relying on year two to break even.
The lever: LTV is the product of AOV, repeat rate and margin, so it moves when any of them moves. Bundles raise the first order, retention flows raise the count, and fewer blanket discounts protect the margin under both.
Cart abandonment rate
Formula: (carts created − orders completed) ÷ carts created × 100.
Where in Shopify: the Conversion rate breakdown funnel shows how many sessions with cart additions reached and completed checkout. For shoppers who entered contact details, Orders > Abandoned checkouts lists each abandoned checkout(opens in a new tab), where you can see patterns and send recovery emails.
What good looks like: Baymard Institute's average across 50 studies(opens in a new tab) is 70.22%. On Shopify stores specifically, Littledata's median(opens in a new tab) is 78% of sessions that added to cart without buying, and the top 20% of stores sit below 65%.
The lever: Baymard found that once "just browsing" is set aside, 40% of abandonments come from extra costs being too high (shipping, tax, fees). Show shipping cost before checkout, add a free shipping progress bar to the cart, and follow up with an abandoned cart email sequence for the checkouts you still lose.
How to track these KPIs without drowning in data
- Pick one north-star number. For a store with fixed traffic, revenue per visitor is the most honest single figure.
- Review weekly: conversion rate, AOV, RPV, cart abandonment. A broken checkout or a promotion that cannibalizes margin shows up here within days.
- Review monthly or quarterly: gross margin by product, repeat purchase rate, cohort LTV. These need time to move.
- Change one lever at a time and note the date in your reports, so you can tie a change in RPV to what caused it.
- Compare with yourself first. Benchmarks tell you if something is badly off; your own trend tells you if you are improving.
If AOV is the weak spot, the fastest fix on existing traffic is an offer built around more than one item: a bundle, a quantity break or a free gift at a cart threshold. Snap Bundle(opens in a new tab) handles all of these on Shopify, is free while bundle revenue stays under $500 a month and costs $12.99 a month after that, with no order cap. For the order after checkout, a one-click post-purchase upsell adds revenue without touching conversion rate.
FAQ
What are the most important ecommerce metrics?
If your ad budget is fixed, start with revenue per visitor, which combines conversion rate and average order value, then gross margin and repeat purchase rate. Together they tell you how much each visit and each customer is worth after costs.
What is the difference between an ecommerce metric and a KPI?
A metric is any number you can measure, such as sessions. A KPI is a metric you have tied to a goal and a target, such as "raise revenue per visitor from $0.84 to $0.95 this quarter". Most stores need five to seven KPIs, not twenty.
How do I calculate revenue per visitor?
Divide revenue by sessions for the same period. In Shopify, take total sales from Total sales over time and divide by sessions from Sessions over time. It also equals conversion rate multiplied by average order value.
What is a good conversion rate for a Shopify store?
Littledata's October 2026 benchmark(opens in a new tab) puts the median Shopify store at 1.4% and the top 20% above 2.7%. Category matters: beauty and skincare stores had a 2.9% median, home and furniture 1.0%.
Where do I find customer lifetime value in Shopify?
Under Analytics > Reports, open Customer cohort analysis and pick Amount spent per customer as the metric. With 24 months of data, the Show projections toggle estimates future spend per cohort. The Predicted spend tier report ranks customers by predicted value.
How often should I review ecommerce KPIs?
Weekly for conversion rate, AOV and revenue per visitor, since a broken checkout or a bad promotion shows up there first. Monthly or quarterly for repeat purchase rate and lifetime value, which need time for customers to come back.

Keep reading

How to Increase ROAS From Your Store, Not Your Ad Account
ROAS = conversion rate × AOV ÷ CPC. Here is how to raise the store side of that formula, landing pages, bundles, checkout, email and LTV, with worked numbers.

Shopify Free Shipping Threshold: How to Set It to Raise AOV
Pick a free shipping threshold from your order data, check the break-even math, set it up in Shopify (rate or discount), and give shoppers an item that closes the gap.

Repeat Purchase Rate: Formula, Benchmarks and 9 Ways to Raise It
The repeat purchase rate formula, how to find it in Shopify analytics, real benchmarks, and 9 ways to get more second orders without spending more on ads.